We established a Sentinel Graph to support the SOC investigation of common security threats across the environment. The Sentinel Graph enables visual exploration of identities, their access paths to cloud resources, and potential attacker techniques for privilege escalation and lateral movement.
The Sentinel Graph experience was introduced as part of Public Preview on September 30, 2025, when Microsoft announced Sentinel Graph as a core capability built on top of the Microsoft Sentinel data lake. Since then, graph‑based experiences have been gradually surfaced across the Microsoft Defender portal, enabling relationship‑driven investigations across identity, cloud resources, and security signals.
As a Public Preview feature, Sentinel Graph continues to evolve, with ongoing additions such as custom graphs, expanded schema coverage, and enhanced querying and visualisation capabilities. Microsoft has stated that pricing information will be communicated in advance before the feature transitions to general availability and billing begins
In addition to the default graph, it is also possible to create custom graphs using the Microsoft Sentinel extension for Visual Studio Code, allowing advanced modelling and investigation scenarios tailored to SOC needs.
This sentinel graph helps security teams:
- Identify exposure points and risky access paths
- Detect misconfigurations across identities and resources
- Strengthen identity and access security posture
- Accelerate incident investigation and threat hunting
For years, defenders were constrained to list‑based queries, forcing analysis in silos and limiting true contextual understanding. Sentinel Graph changes this paradigm by enabling defenders—and their AI agents—to instantly uncover relationships and traversable digital paths across identities, applications, and resources. By visualizing blast radius, privilege escalation paths, and anomalous connections at cloud scale, SOC teams gain deep, actionable context across their entire digital estate, allowing them to move from reactive investigation to proactive and resilient security operations.
How the Sentinel Graph Works
The Sentinel Graph visualises:
- Identities (users, groups, service principals)
- Cloud resources that they can access
- Permissions and role assignments
- Potential attack paths an adversary could exploit
By combining identity data, role assignments, and resource relationships, the graph models how access and privileges flow across the environment.
We enabled and configured the Sentinel Graph, which provides a relationship‑based view of identities, their access to cloud resources, and the potential paths an attacker could exploit for privilege escalation and lateral movement.
Instead of analysing isolated logs or permissions in silos, the graph models how identities, roles, and resources are connected across the environment. This makes it possible to visualize attack paths, identify exposure points and excessive permissions, detect misconfigurations, and proactively strengthen the overall identity security posture.
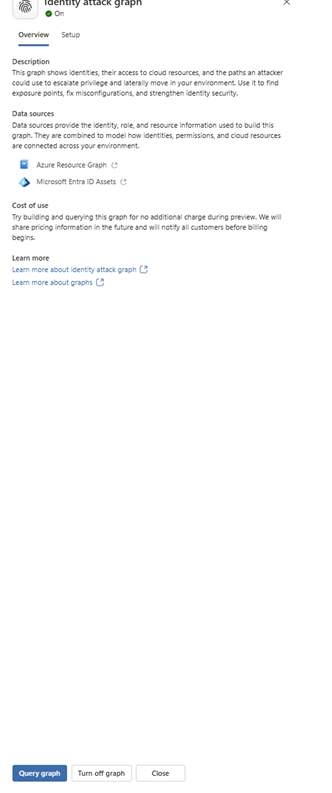
Data Sources
The Sentinel Graph is built using multiple data sources that provide identity, role, and resource context. These sources are correlated to model how identities, permissions, and cloud resources are connected across the environment.
By combining this data, Sentinel Graph enables relationship‑based investigations and attack‑path analysis instead of isolated log review.
Prerequisites
To build and query Sentinel Graphs, the following prerequisites must be met:
- Microsoft Sentinel Data Lake must be enabled
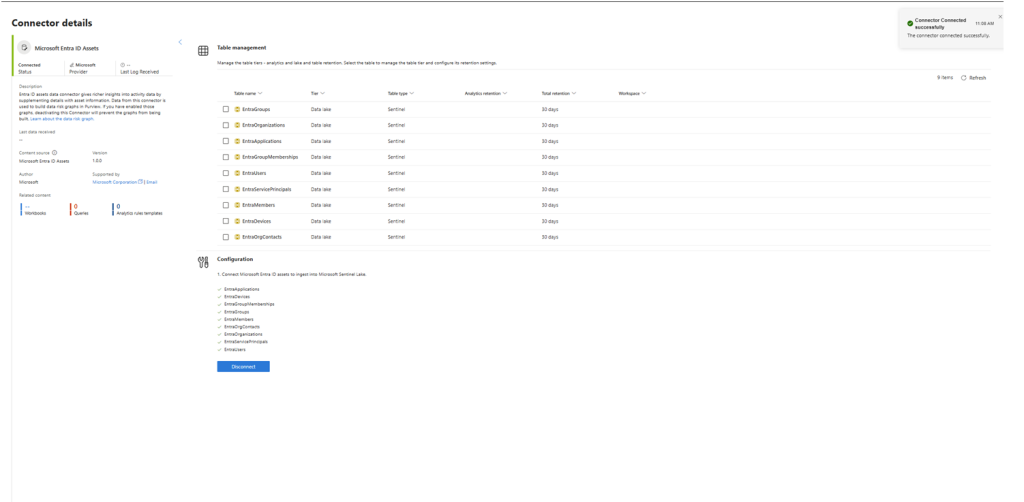
- Required data connectors must be installed and connected
Supported Data Sources
- Microsoft Entra ID Assets
Microsoft Entra ID Assets provide detailed identity information, including users, groups, service principals, and their relationships. This identity context is critical for understanding access paths, privilege inheritance, and lateral movement opportunities.
We installed and enabled the following two connectors as mandatory prerequisites for Sentinel Graph.
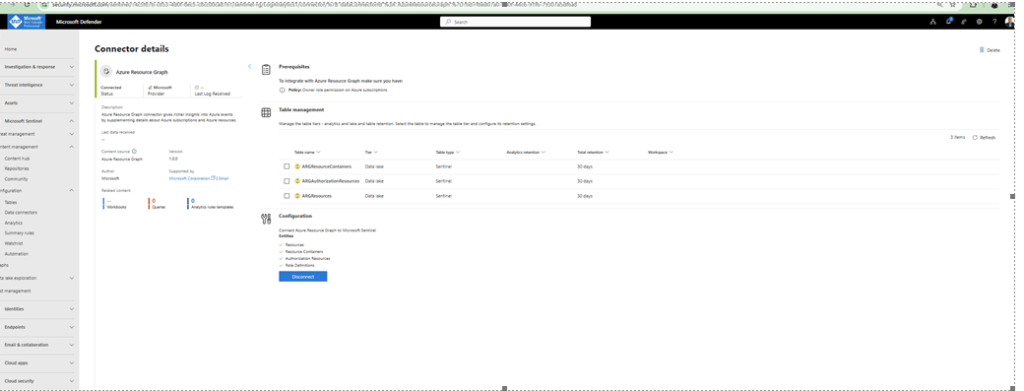
2. Azure Resource Graph
Azure Resource Graph provides visibility into Azure subscriptions, resource groups, and individual Azure resources. This data is used to model how identities interact with cloud resources and to represent Azure hierarchy and resource relationships within the graph.
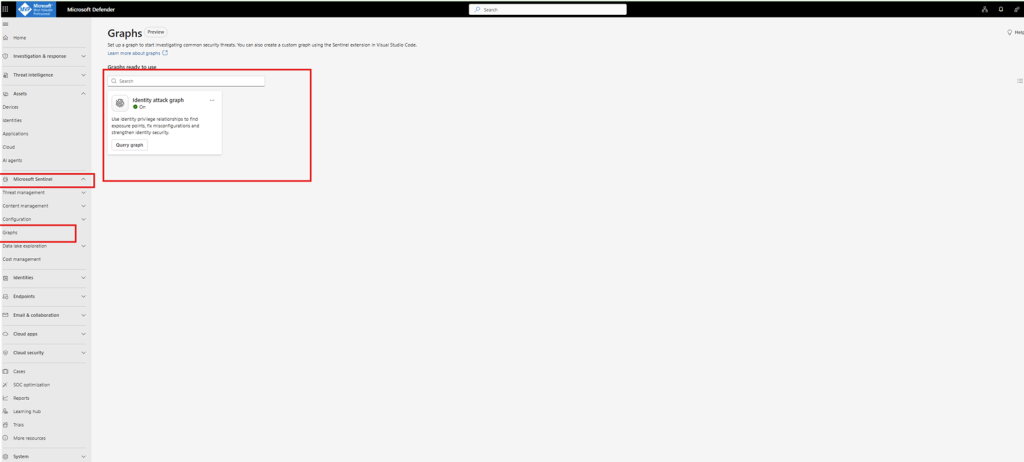
Description of the Sentinel Graph Interface
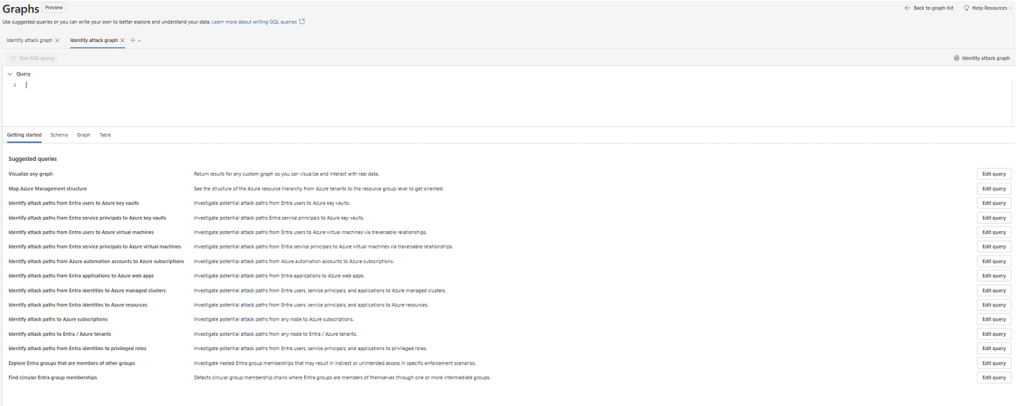
This shows the Graphs ( Public Preview) experience in the Microsoft Defender portal under Microsoft Sentinel, specifically focused on the Identity attack graph.
This represents the starting point for graph‑based investigations in Microsoft Sentinel. It combines graph querying, visualisation, and guided investigation scenarios in a single interface.
Key Elements in the Interface
Graph Type
- The selected graph is the Identity attack graph
- This graph is designed to investigate potential attack paths across:
- Microsoft Entra ID identities
- Azure resources
- Privileged roles and permissions
The graph operates in Preview, as indicated at the top of the page.
Query Editor
- At the top of the interface is the Graph Query editor
- This is where users write KQL graph queries to explore relationships
- The editor supports:
- Custom graph queries
- Editing pre‑defined investigation queries
- Switching between query, schema, graph, and table views
Suggested Queries Panel
Below the query editor, the interface displays a list of pre‑built suggested graph queries, designed to accelerate investigations.
Examples visible in the image include:
- Visualise any graph
- Map Azure Management structure
- Identity attack paths from Entra users to Azure Key Vaults
- Identity attack paths from service principals to virtual machines
- Identity attack paths to Azure subscriptions
- Identity attack paths to privileged roles
- Explore Entra group memberships and detect circular group relationships
Each suggested query includes:
- A short description of the investigation scenario
- An “Edit query” button, allowing SOC analysts to customise the logic
Investigation Use Case Focus
The suggested queries are clearly aligned with Identity‑centric attack path analysis, helping analysts:
- Understand how identities can traverse Azure environments
- Detect indirect access paths and excessive permissions
- Identify privilege escalation and lateral movement opportunities
- Analyze nested group memberships and privilege inheritance
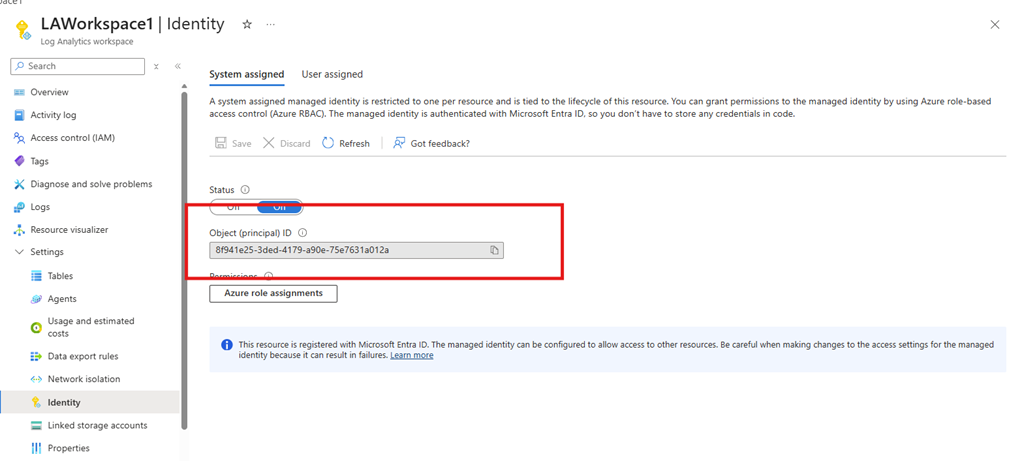
On the Log analytics workspace must be turn on system assigned managed identity and assigned on subscription level with owner role
What This Interface Enables
This screen highlights the shift from log‑based to relationship‑based investigations:
- Instead of manually correlating tables and logs
- Analysts can visually explore how identities, permissions, and resources are connected
- Investigation becomes interactive, intuitive, and attacker‑path oriented
Visualising Any Graph Using KQL
One of the most powerful aspects of Sentinel Graph is that any relationship‑based data can be visualized as a graph using KQL. As long as the underlying data contains nodes and relationships, it can be rendered as an interactive graph for exploration and investigation.
At its simplest form, the following KQL query visualises all nodes and edges available in the current graph scope:
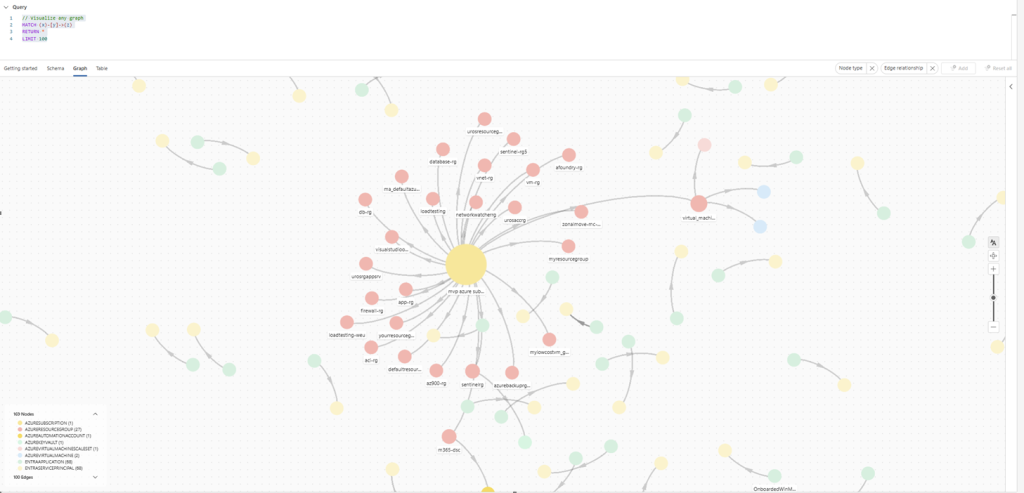
// Visualize any graph
MATCH (x)-[y]->(z)
RETURN *
LIMIT 100
This query instructs Sentinel Graph to:
- Match any relationship (
y) between any two nodes (xandz) - Return the full set of connected entities
- Render the result as a graph visualization instead of a traditional table
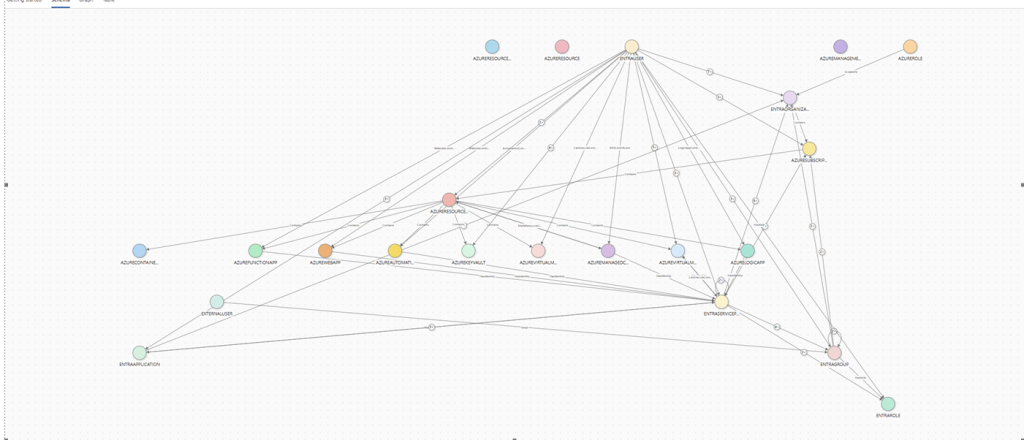
What the Graph Visualisation Shows
As illustrated in the image above, the resulting visualisation presents the environment as an interconnected relationship map:
- Nodes represent entities such as:
- Entra ID users and service principals
- Azure subscriptions, resource groups, and resources
- Applications, roles, and managed identities
- Edges represent relationships such as:
- Role assignments
- Resource access permissions
- Identity‑to‑resource connections
Why This Matters for Security Investigations
Instead of manually correlating permissions across multiple tables, this approach enables analysts to:
- Visually trace attack paths and privilege escalation routes
- Identify high‑risk identities and excessive permissions
- Understand blast radius by following connected entities
- Detect indirect or inherited access that would be difficult to spot in tabular queries
This is a fundamental shift from log‑centric analysis to relationship‑centric investigation, aligning defender workflows with how attackers actually move through cloud environments.
Understanding the Graph Schema
Before writing custom KQL graph queries or interpreting visualisations, it is important to understand the graph schema. The schema defines which node types and relationship types exist, and how different entities in the environment are connected.
In Sentinel Graph, the schema acts as the contract between raw data and graph visualization. It describes:
- What entities can appear as nodes
- What relationships can exist between them
- Which properties are available for filtering and analysis
Node Types
Nodes represent entities in the environment. Depending on enabled data sources, the graph schema may include nodes such as:
- Entra ID identities
- Users
- Service principals
- Managed identities
- Entra ID groups
- Azure resources
- Subscriptions
- Resource groups
- Virtual machines
- Key Vaults
- Web apps, function apps, storage accounts, etc.
- Security and access objects
- Azure roles
- Privileged role assignments
- Applications
Each node type is visually distinguished in the graph by color and icon, making it easier to identify identity‑centric versus resource‑centric components during investigations.
Relationship (Edge) Types
Edges represent relationships between nodes and are the key element that enables attack‑path analysis.
Common relationship examples include:
- Identity member of group
- Identity assigned role
- Role grants access to resource
- Identity has access to Azure resource
- Group contains nested group or identity
These relationships describe how permissions are inherited, delegated, or indirectly exposed — exactly the paths attackers aim to exploit.
Exploring the Schema in the UI
The Schema tab in the Graph interface provides a structured overview of:
- Available node types
- Supported relationship types
- Valid connections between entities
This allows analysts to:
- Understand which relationships can be queried
- Design precise KQL graph queries
- Avoid blind or overly broad graph traversals
Schema awareness is especially important when building custom queries, because it defines what can be matched in MATCH (x)-[y]->(z) patterns.
Why Schema Matters
Understanding the schema enables security teams to:
- Write accurate and efficient graph queries
- Correctly interpret graph outputs
- Distinguish between direct and indirect access paths
- Avoid false assumptions during investigations
Without schema context, graph visualisations may look impressive but can easily be misinterpreted. With schema knowledge, the graph becomes a precise analytical tool rather than just a visual aid.
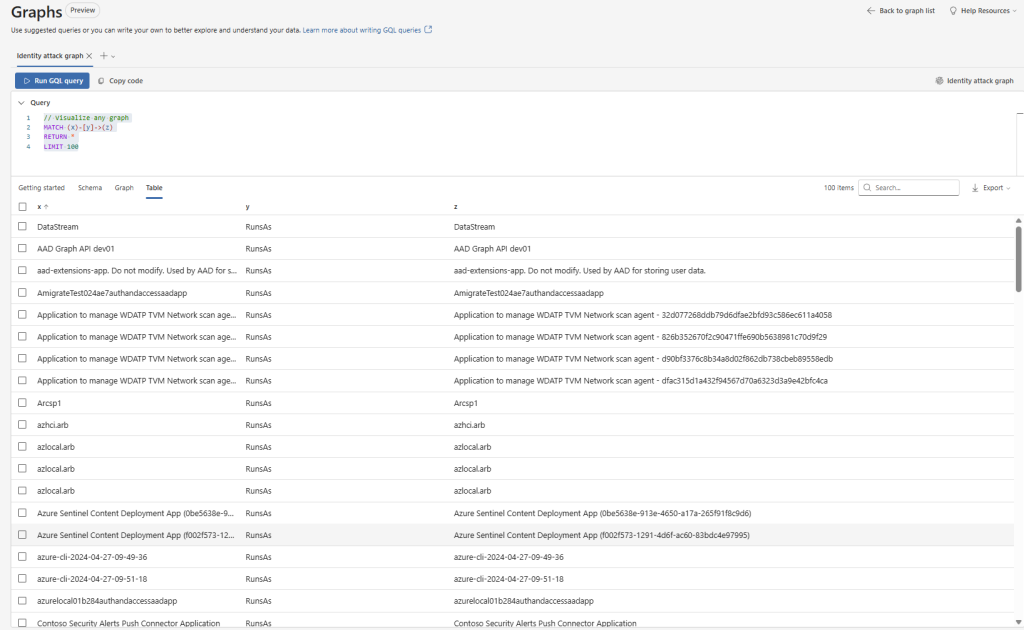
Example of Table for KQL Query
// Visualize any graph
MATCH (x)-[y]->(z)
RETURN *
LIMIT 100
This view shows the Graphs interface in Microsoft Sentinel, where a KQL graph query is executed and the results are displayed in table form, listing nodes (x, z) and their relationships (y) that can also be visualized as an interactive graph.
Conclusion
Sentinel Graph represents a fundamental shift in how security investigations are performed in cloud environments. Instead of manually correlating logs, permissions, and identity data across multiple tools, security teams can now investigate threats by following relationships and access paths — exactly the way attackers operate.
By combining identity data from Microsoft Entra ID, resource context from Azure Resource Graph, and the scalability of the Microsoft Sentinel Data Lake, Sentinel Graph enables a relationship‑driven investigation model. Identities, resources, and permissions are no longer isolated data points, but interconnected entities that can be explored, queried, and visualised.
The ability to visualise any graph using KQL is especially powerful. It allows SOC teams to move seamlessly from exploratory analysis to targeted attack‑path investigations, uncovering privilege escalation opportunities, indirect access paths, and misconfigurations that are difficult — or impossible — to detect using traditional queries alone.
Understanding the graph schema is critical to unlocking this potential. Schema awareness enables precise queries, correct interpretation of results, and efficient investigation workflows. Without it, graph visualisations risk becoming visually impressive but analytically shallow.
Ultimately, Sentinel Graph is not just a visualisation feature — it is a new investigation paradigm. For SOC teams operating in complex cloud environments, this shift from log‑centric to relationship‑centric security analysis is essential for understanding real attack paths, reducing exposure, and responding faster and more effectively to modern threats.
As this capability continues to evolve beyond preview, it is already clear that graph‑based security investigations are becoming a core pillar of Unified SecOps.