Microsoft Sentinel’s security analytics and operations data is stored in an Azure Monitor Log Analytics workspace.
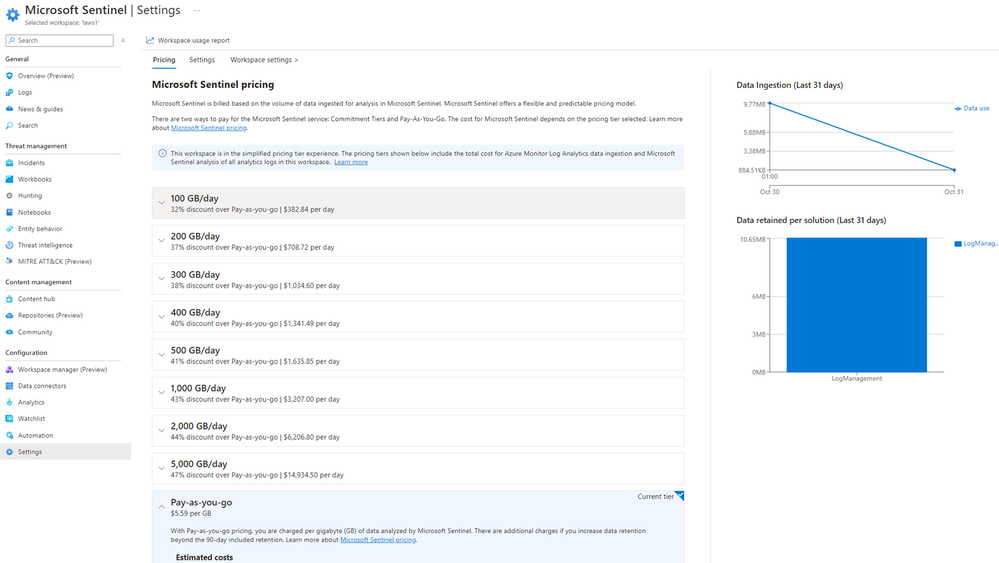
Billing is based on the volume of data analyzed in Microsoft Sentinel and stored in the Log Analytics workspace.
The cost of both is combined in a simplified pricing tier.
Microsoft 365 data sources are always free to ingest for all Microsoft Sentinel users:
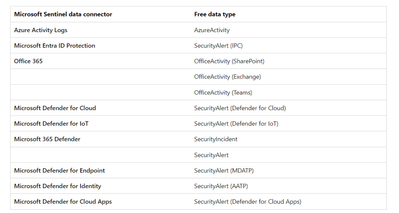
Billable data sources:
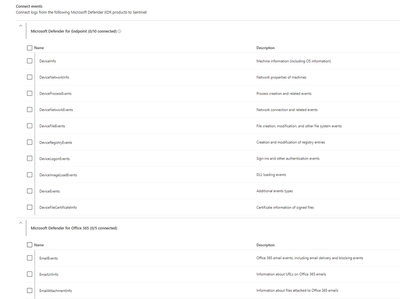
Although alerts are free, the raw logs for Microsoft Endpoint Defender, Defender for Cloud Apps, Microsoft Entra ID sign in and audit logs, and Azure Information Protection (AIP) data types are paid:
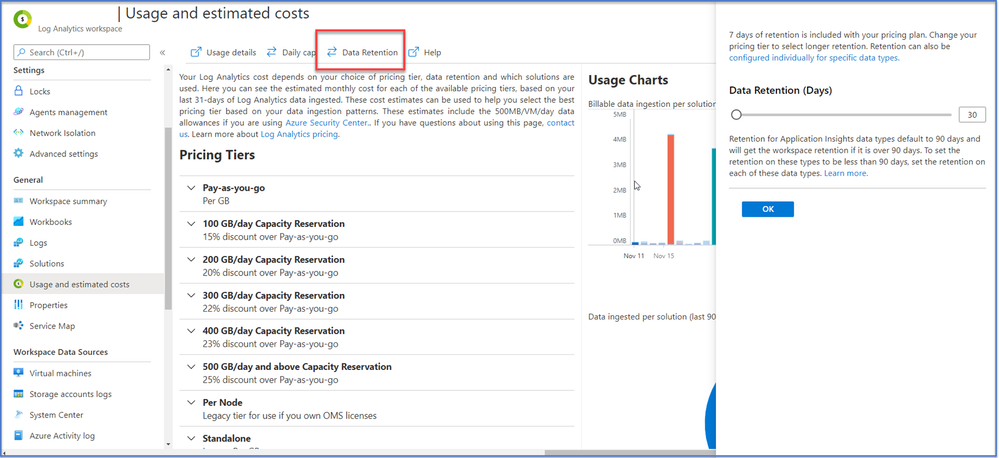
Microsoft Sentinel data retention is free for the first 90 days.
Enable Microsoft Sentinel on an Azure Monitor Log Analytics workspace and the first 10 GB/day is free for 31 days.
The cost for both Log Analytics data ingestion and Microsoft Sentinel analysis charges up to the 10 GB/day limit are waived during the 31-day trial period.
This free trial is subject to a 20 workspace limit per Azure tenant
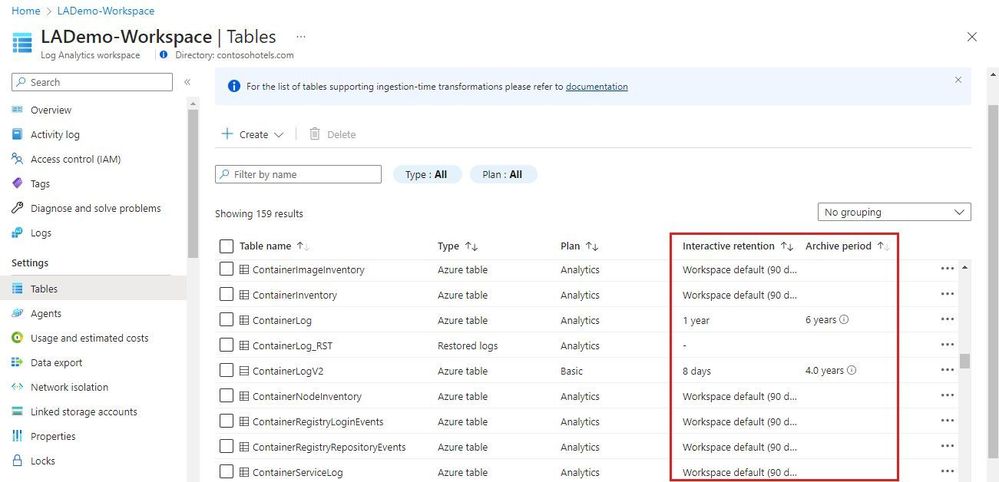
• By default, all tables in your workspace inherit the workspace’s interactive retention setting and have no archive.
• You can modify the retention and archive settings of individual tables
Azure Monitor Logs retains data in two states:
– Interactive retention: Lets you retain Analytics logs for interactive queries of up to 2 years.
– Archive: Lets you keep older, less used data in your workspace at a reduced cost.
• You can access data in the archived state by using search jobs, restore and keep data in archived state for up to 12 years
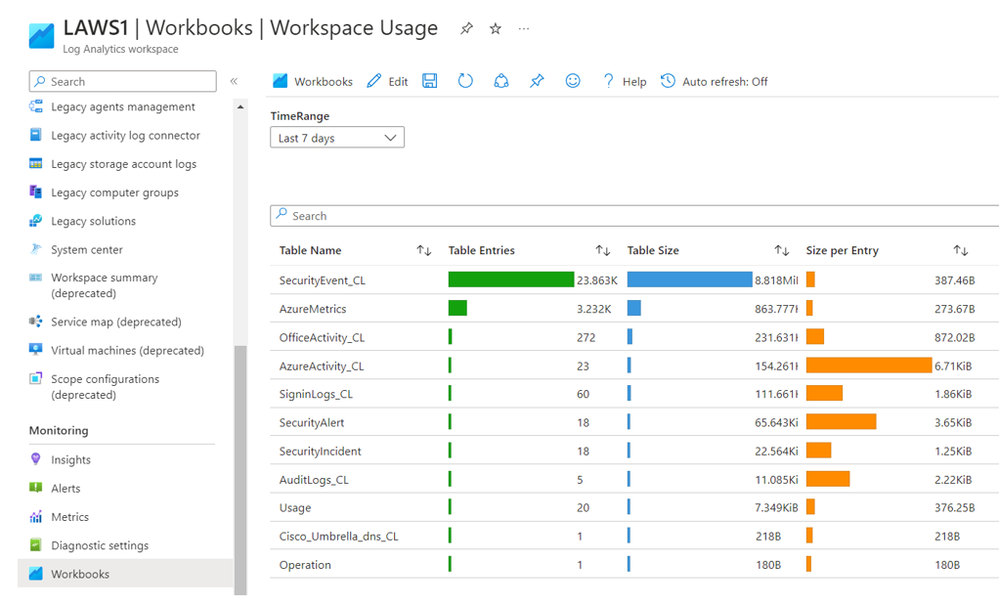
• Its very important for cost management in MS Sentinel when you define short data retention period, but firstly go in Log Analytics WS | Workbooks | Workspace Usage in order to see tables size
Use this workbook to analyze the the sizes of the different tables in your workspace:
• Total volume (in GB) of data ingested that is billed to the Threat Protection Engagement sponsored Azure subscription:
// Total volume
Usage | where TimeGenerated > startofday(ago(31d))
| where IsBillable == true
| summarize TotalVolumeGB = sum(Quantity) / 1000
// Total volume, by day
Usage | where TimeGenerated > startofday(ago(31d))
| where IsBillable == true
| summarize TotalVolumeGB = sum(Quantity) / 1000 by bin(TimeGenerated, 1d)
| sort by TimeGenerated asc
// Total volume, by day, in graphical format
Usage | where TimeGenerated > startofday(ago(31d))
| where IsBillable == true
| summarize TotalVolumeGB = sum(Quantity) / 1000 by bin(TimeGenerated, 1d)
| sort by TimeGenerated asc
| render barchart
• Volume (in GB) of data ingested that is billed to the Threat Protection Engagement sponsored Azure subscription, summarized by Solution and Data Type (i.e. type of source):
// Volume by type of source
Usage | where TimeGenerated > startofday(ago(31d))
| where IsBillable == true
| summarize VolumeGB = sum(Quantity) / 1000. by Solution, DataType
| sort by Solution asc, DataType asc
// Volume by type of source, in graphical format
Usage | where TimeGenerated > startofday(ago(31d))
| where IsBillable == true
| summarize VolumeGB = sum(Quantity) / 1000. by Solution, DataType
| sort by Solution asc, DataType asc
| render barchart
• Volume (in GB) of data ingested that is billed to the Threat Protection Engagement sponsored Azure subscription, for single type of source, in this case from Microsoft Entra ID:
// Volume from one type of source
Usage | where TimeGenerated > startofday(ago(31d))
| where IsBillable == true
| where DataType == “SigninLogs”
| summarize VolumeGB = sum(Quantity) / 1000
// Volume from one type of source, by day
Usage | where TimeGenerated > startofday(ago(31d))
| where IsBillable == true
| where DataType == “SigninLogs”
| summarize VolumeGB = sum(Quantity) / 1000 by bin(TimeGenerated, 1d)
| sort by TimeGenerated asc
// Volume from one type of source, by day, in graphical format
Usage | where TimeGenerated > startofday(ago(31d))
| where IsBillable == true
| where DataType == “SigninLogs”
| summarize VolumeGB = sum(Quantity) / 1000 by bin(TimeGenerated, 1d)
| sort by TimeGenerated asc
| render barchart
NOTE: You can replace the following line in the queries above to obtain the volume of data from other types of billable resources:
| where DataType == “SigninLogs”
For data from Windows Servers, replace it with:
| where DataType == “SecurityEvent” or Solution == “DnsAnalytics” or Solution == “WindowsFirewall”
For data from Windows Servers from Syslog sources (includes data formatted in CEF and data from Linux servers), replace it with:
| where DataType == “Syslog” or DataType == “CommonSecurityLog”
• Volume (in GB) of data ingested that is billed to the Threat Protection Engagement sponsored Azure subscription, from Windows Servers, Linux Servers or from the Syslog agent VM and all firewalls or network proxy servers that send their Syslog of CEF logs through it
// Volume sorted by amount
Usage | union withsource = tt *
| where TimeGenerated > startofday(ago(31d))
| where _IsBillable == true
| extend computerName = tolower(tostring(split(Computer, ‘.’)[0]))
| summarize GBytes=sum(_BilledSize) / 1000000000 by computerName
| where computerName != “”
| sort by GBytes nulls last
// Volume, by the day, in graphical format
Usage | union withsource = tt *
| where TimeGenerated > startofday(ago(31d))
| where _IsBillable == true
| extend computerName = tolower(tostring(split(Computer, ‘.’)[0]))
| summarize GBytes=sum(_BilledSize) / 1000000000 by computerName, bin(TimeGenerated, 1d)
| where computerName != “”
| sort by TimeGenerated, computerName
| render columnchart
Once the volume of data is obtained, the cost of the data ingestion into the Azure Log Analytics workspace can be calculated based on the “pay-as-you-go” price that is available from:
https://azure.microsoft.com/en-us/pricing/details/monitor/
NOTE: make sure you select the data center containing the Azure Log Analytics workspace used for the Microsoft Sentinel deployment to obtain the correct price per GB of ingested data.
Data ingestion into Microsoft Sentinel will be free during the period of the Threat Protection Engagement, as long as you stay within the standard scope of the engagement and you didn’t use the Microsoft Sentinel trial before. For more details please look at the section “Free Trial” from below link:
https://azure.microsoft.com/en-us/pricing/details/microsoft-sentinel/
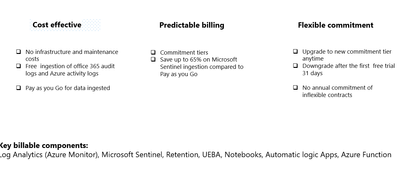
Where can save your money?
Ingestion
• Carefully plan what data is sent into your Microsoft sentinel workspace
• Utilize filtering mechanisms to reduce ingestions to what the SOC needs
• Set daily cap (good for PoC scenarios but not recommend for production)
Retention
• Send data to other storage platforms that have cheaper storage costs (Azure blob storage, Azure data explorer)
Compute
• Shutdown Azure machine learning compute during off hours, consider using reserved instances pricing
• Set quotas on your subscription and workspaces
• Use low-priority virtual machine (VM)
Bandwidth
• Sending data across Azure regions might incur into additional costs
Ingestion planning
• Analyze your data sources and decides what data is needed by your SOC for detection, investigations, hunting and enrichment. Take use-driven approach
• Plan your workspace design
• Existing workspaces might be ingesting data not needed by the SOC
• Consider using separate workspace for Microsoft Sentinel
• When possible enable Defender for Servers on the same workspace where you enable Microsoft Sentinel, you get 500 MB of free data ingestion per day
• If you configure your Log Analytics agent to send data to two or more different Log Analytics workspaces (multi-homing), you’ll get 500-MB free data ingestion for each workspace.
Retention
• Microsoft Sentinel retention is charged ($0.1/GB/month) and can become a big portion of the Microsoft Sentinel cost
• 1.2 TB/day ingestion with 1-year retention (East US list prices)
Ingestion: ~ $89К/month
Retention: ~ $33К/month
• If you require more than 90 days retention, determine if you need it for the whole workspace or just some tables
• Consider using other storage platform for long storage retention (Azure blob storage, Azure data explorer)
Long term retention options:
• Azure blob storage
• Cheaper than Microsoft sentinel retention
• Difficult for query
• Ideal for audit/compliance purposes
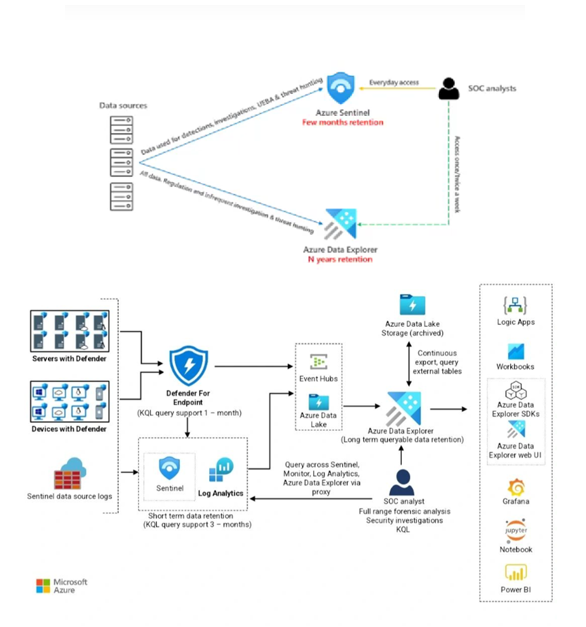
Azure Data explorer
Stores security logs in Azure Data Explorer on a long-term basis.
Minimizes costs and provides easy access when you need to query the data and stores most of the data in the cold cache, minimizing the computing cost.
Log Analytics doesn’t currently support exporting custom log tables. In this scenario, you can use Azure Logic Apps to export data from Log Analytics workspaces.
Because Azure Data Explorer provides long-term storage, you can reduce your Sentinel retention costs with this approach and ideal for forensic investigation and hunting on older data
Can achieve up to 75% saving on retention costs
Instead of using Azure Data Explorer for long-term storage of security logs, you can use Storage.
This approach simplifies the architecture and can help control the cost.
A disadvantage is the need to rehydrate the logs for security audits and interactive investigative queries.
With Azure Data Explorer, you can move data from the cold partition to the hot partition by changing a policy. This functionality speeds up data exploration.
Bandwidth
Sending telemetry from one Azure region to another can incur in bandwidth costs
this only affect Azure VMs that send telemetry across Azure regions
data sources based on diagnostics settings are not affected
not a big cost component compared to ingestion or retention
Example: 1000 VMs, where each generates 1GB/day, sending data from US to EU:
1000 VMs * 1GB/day *30 days/month*$0.05/GB =$1.500/month
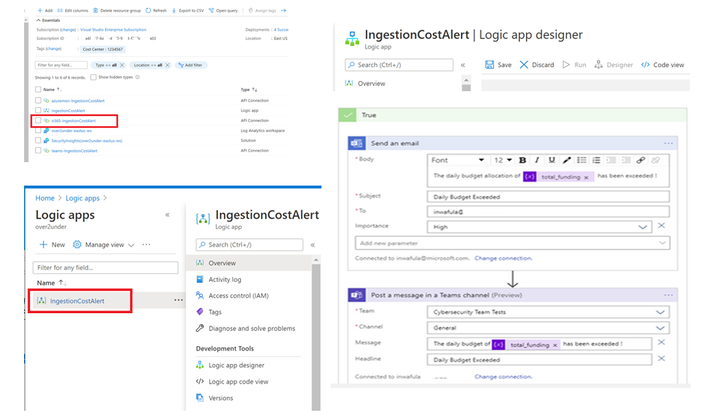
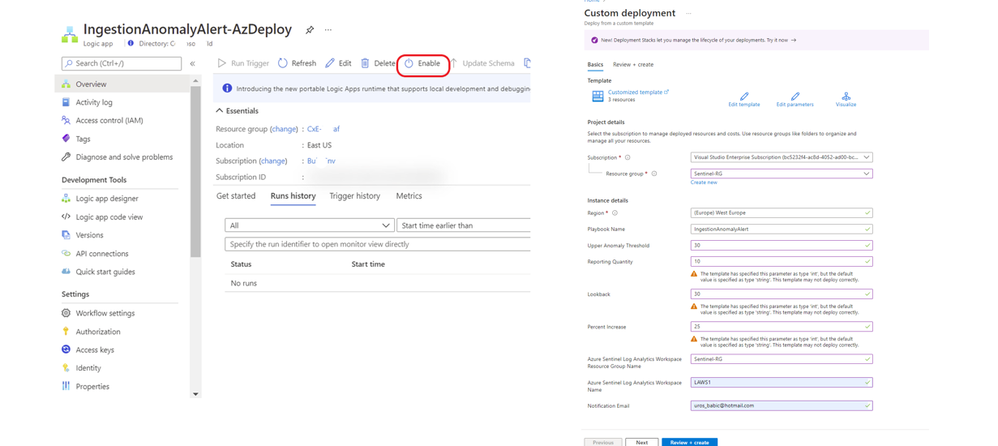
Ingestion Cost Alert Playbook
https://techcommunity.microsoft.com/t5/microsoft-sentinel-blog/ingestion-cost-alert-playbook/ba-p/2006003
Managing cost for cloud services is an essential part of ensuring that you get maximum value for your investment in solutions running on this computing platform. Azure Sentinel is no different.
To help you exercise greater control over your budget for Azure Sentinel this playbook will send you an alert should you exceed a budget that you define for your Azure Sentinel Workspace within a given time-frame
With the ingestion cost alert playbook, you can set up an alert based on the budget defined in your Microsoft Sentinel workspace within a given timeframe.
Ingestion Cost Spike detection Playbook
This playbook sends you an alert should there be an ingestion spike into your workspace. The playbook uses the series_decompose_anomalies KQL function to determine anomalous ingestion
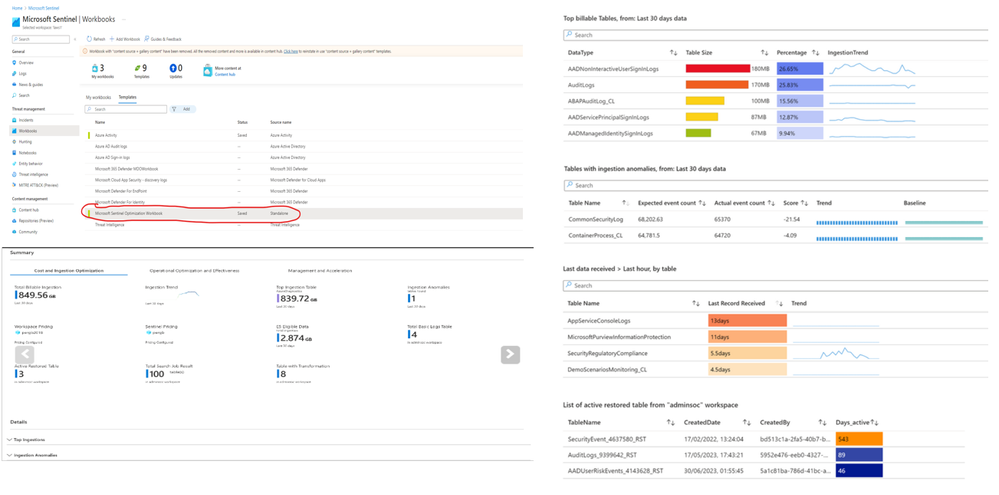
The Workspace Usage Report workbook
The Workspace Usage Report workbook provides your workspace’s data consumption, cost, and usage statistics.
The workbook gives the workspace’s data ingestion status and amount of free and billable data. You can use the workbook logic to monitor data ingestion and costs, and to build custom views and rule-based alerts.
This workbook also provides granular ingestion details.
The workbook breaks down the data in your workspace by data table, and provides volumes per table and entry to help you better understand your ingestion patterns.
Azure pricing model – based on volume of data ingested
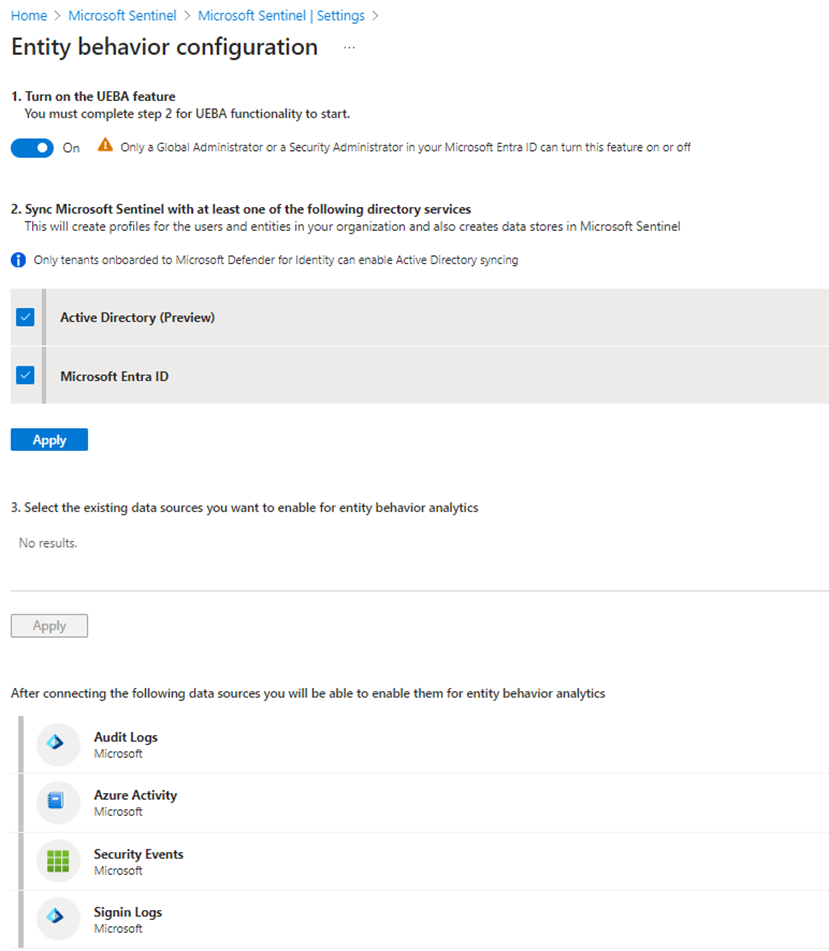
User Entity Behavior Analytics
Approximately 10% of the cost of logs selected for UEBA
Reduce To change your pricing tier commitment, select one of the other tiers on the pricing page, and then select Apply. You must have Contributor or Owner role in Microsoft Sentinel to change the pricing tier costs for Microsoft Sentinel
One response to “FinOps in Microsoft Sentinel”
I genuinely prize your piece of work, Great post.